

Short-Term Bounce Signals Emerge as Solana price Suffers Heavy Capitulation

The market is showing clear stress, and Solana price is now trading in a zone where forced selling, extreme fear, and short-term reflex bounces can all collide.
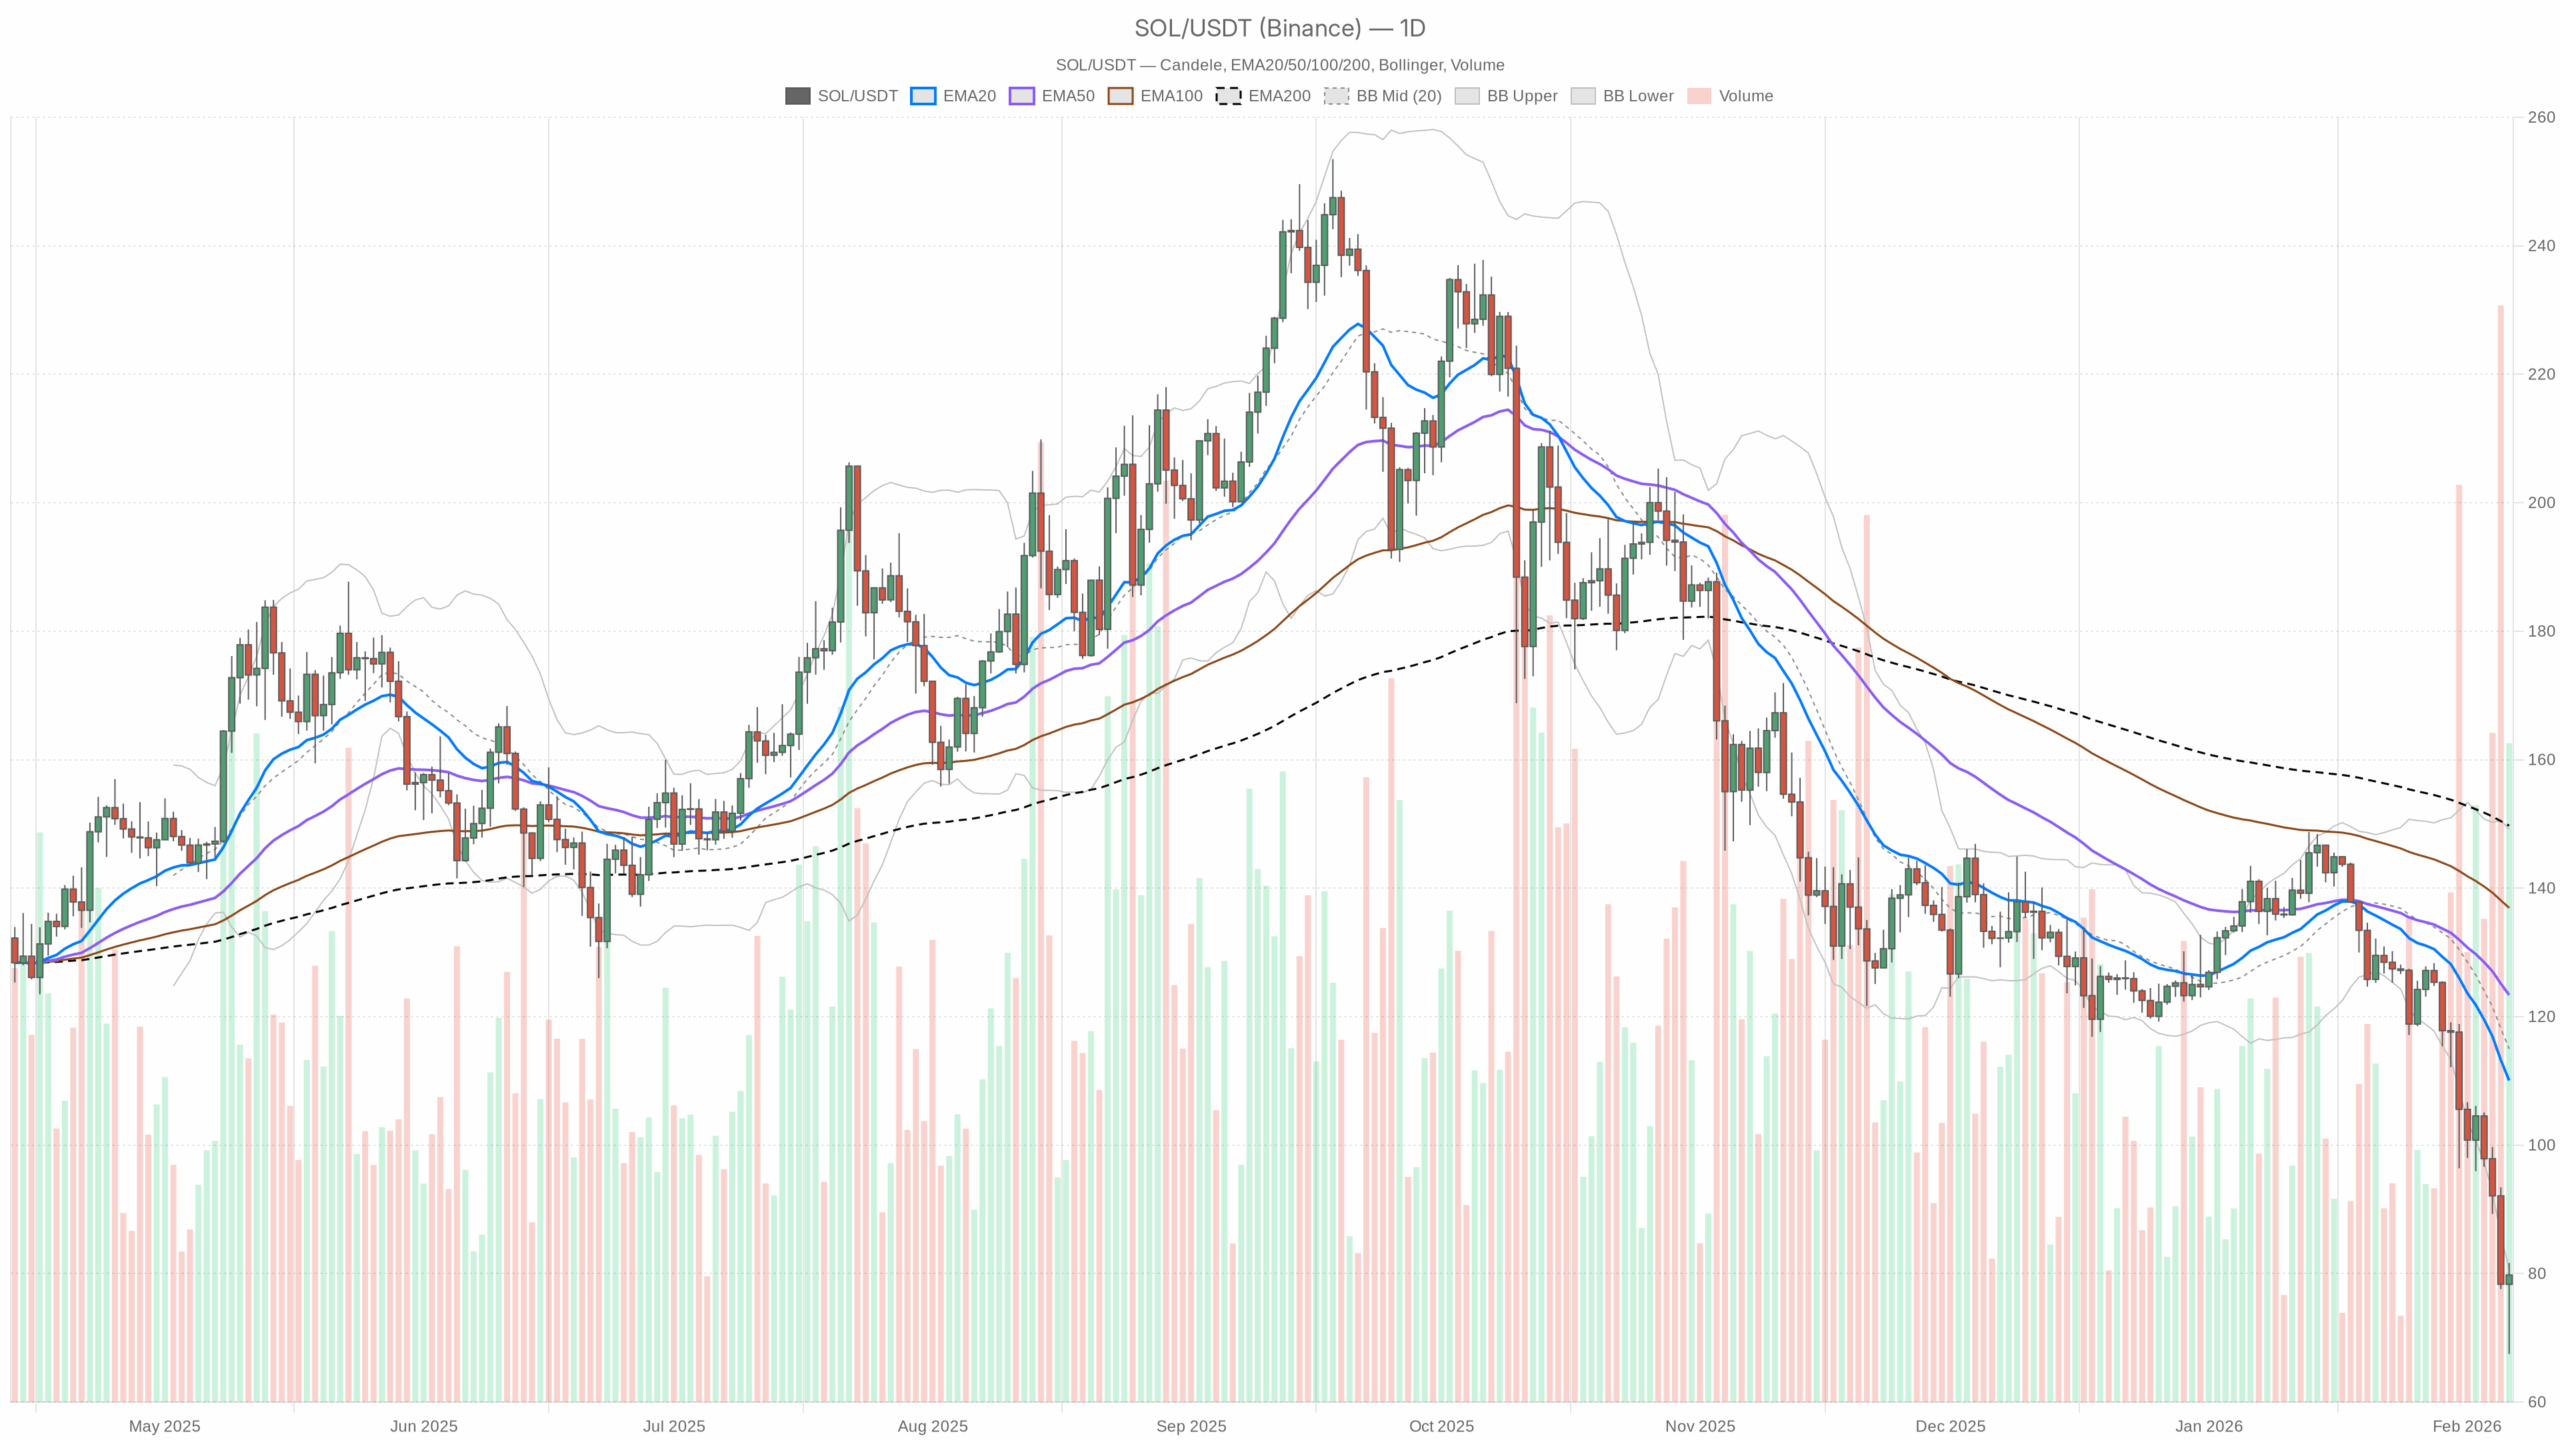 SOL/USDT daily chart with EMA20, EMA50 and volume”
loading=”lazy” />SOL/USDT — daily chart with candlesticks, EMA20/EMA50 and volume.
Solana price: daily trend is broken, market trades like forced selling
Solana price against USDT is trading around $79–80, deep below its prior range and well under all key daily moving averages. This is not a mild correction; it looks like a full-blown liquidation phase in a crypto market that just saw a ~7.5% drop in total market cap and a spike in volume. BTC dominance near 56% and a fear & greed index at 9 (Extreme Fear) show what is driving flows: de-risking and forced selling, not patient rotation.
At this moment, the dominant force for Solana price is trend unwinding. The daily structure is firmly bearish, but intraday time frames are starting to stabilize, hinting at a possible short-term bounce inside a still-damaged macro trend. That tension between washed-out daily momentum and neutral intraday tone is the core of the current setup.
Daily chart (D1): macro bias clearly bearish
Price & EMAs
Solana price on the daily close is $79.79 with:
- EMA 20: $110.07
- EMA 50: $123.37
- EMA 200: $149.74
- Regime flag: bearish
Price is trading roughly 27% below the 20‑day EMA and even further below the 50 and 200. When an asset lives this far beneath its short and long EMAs, it signals a broken uptrend and aggressive trend-following selling. Any bounce from here is, by default, a rally into overhead supply until price can reclaim at least the 20‑day EMA.
RSI (14): 21.45
Daily RSI is deep in oversold territory. This is the kind of reading you typically see during capitulation or late-stage liquidations. It shows that the selloff has been both fast and one-sided. However, oversold does not automatically mean a bottom; in strong bear phases, RSI can stay depressed while price grinds lower. What it does say is that downside reward is compressing while short-term squeeze risk is rising.
MACD: line -12.38, signal -7.98, histogram -4.40
MACD is firmly negative with the line below the signal and a solid negative histogram. Momentum on the daily is still pointed down. There is no confirmed daily momentum reversal yet. This backs the idea that any near-term bounce would still be countertrend on this time frame.
Bollinger Bands: mid $114.99, upper $149.19, lower $80.80
Price is pinned right at the lower band (~$80.8) with a close at $79.79. Trading at or slightly outside the lower band after a strong drop usually marks exhaustion or panic. It is where short-term sellers start to run out of ammo and where mean-reversion traders begin probing. Still, as long as the band is sliding down and price cannot retake the middle band (~$115), the larger structure stays bearish.
ATR (14): $9.60
The daily ATR near $9.6 signals elevated volatility. Swings of 10–12% in a single day are fully on the table. This level of volatility usually coincides with liquidations and forced repositioning. It means both sides, longs and shorts, have to accept larger intraday ranges and greater slippage risk.
Daily Pivot Levels (reference from the system):
Pivot point (PP): $76.31
Resistance R1: $85.13
Support S1: $70.98
With Solana price at $79.79, it is trading just above the main daily pivot. The first resistance band is around $85. That is the nearest level where short-term profit taking by dip buyers and new shorts can reasonably appear. On the downside, the first support band is ~$71. If that breaks, it confirms that sellers are still firmly in control and that the capitulation phase is not done.
Daily takeaway: The D1 time frame is decisively bearish. Trend is broken, momentum is down, but conditions are stretched enough to justify a short-term relief rally. Macro bias: bearish until price at least reclaims the 20‑day EMA and holds above it.
1‑hour chart (H1): still bearish, but the bleeding is slowing
Price & EMAs
On H1, Solana price is $79.75 with:
- EMA 20: $81.53
- EMA 50: $87.19
- EMA 200: $101.52
- Regime flag: bearish
Price is still below the 20‑hour EMA, but only by a small margin, and far below the 50 and 200. That says the short-term downtrend is losing speed, even if it is not yet reversed. The 20‑hour EMA around $81.5 is the first intraday inflection: regain and hold it, and you start building a base; reject it, and the trend resumes lower.
RSI (14): 41.4
On the hourly, RSI has climbed from deeply oversold readings back toward neutral, but it is still below 50. This is what you usually see in a pause inside a downtrend. Selling pressure has eased, but buyers have not seized momentum. It opens the door to either a grindy base-building phase or another leg down if macro pressure returns.
MACD: line -3.01, signal -3.43, histogram +0.42
The MACD line is still negative, but the histogram has turned slightly positive. That is the first sign of a short-term momentum inflection: bears are no longer in complete control on this time frame. If this positive histogram persists and the MACD line crosses back above the signal, you would have confirmation of a short-term relief move inside the broader downtrend.
Bollinger Bands: mid $81.35, upper $89.39, lower $73.31
Price is trading just under the middle band on H1. After hugging the lower band during the drop, moving back toward the midline reflects a shift from panic selling to more balanced two-way trade. To talk about a proper intraday recovery, Solana price needs to establish itself above the mid-band (~$81–82) and start using it as support rather than resistance.
ATR (14): $3.52
Hourly ATR around $3.5 means the typical bar range is roughly 4–5%. Volatility remains elevated but has calmed down compared to the daily shock. For intraday traders, this still means wider stops and careful position sizing are necessary.
Hourly Pivot Levels:
Pivot point (PP): $79.71
Resistance R1: $80.65
Support S1: $78.80
Current price is hovering right at the hourly pivot. This is a classic decision zone after a selloff. A steady hold above $79.7–80.7 would support the case for a push toward the hourly upper band and daily R1 (~$85). Failure and sustained trade below $78.8 would signal that the pause was just a breather before another leg down.
Hourly takeaway: H1 remains bearishly aligned with the daily, but intraday momentum is stabilizing. It is early-stage repair, not a trend change.
15‑minute chart (M15): neutral, short-covering bounce territory
Price & EMAs
On M15, Solana price is $79.76 with:
- EMA 20: $79.11
- EMA 50: $79.75
- EMA 200: $87.19
- Regime flag: neutral
Price is above the 20‑EMA and sitting right on the 50‑EMA. Very short term, that is what a stabilizing or base-building pattern looks like after a flush. However, the 200‑EMA at $87 remains far above, so this is still just a bounce inside a bigger downtrend. The neutral regime tag fits: neither bulls nor bears are in full control on the execution time frame.
RSI (14): 54.66
RSI on M15 is slightly above 50, which lines up with a short-term relief rally or short covering rather than aggressive new buying. Momentum is mildly positive here, providing some breathing room for intraday longs, but it is not strong enough on its own to argue for a trend reversal.
MACD: line 0.44, signal 0.30, histogram 0.14
MACD has crossed into positive territory with a small positive histogram. Short-term momentum has flipped up. Typically, this type of profile appears after the heaviest part of the selling is done, as scalpers and short-term traders step in to fade the extremes. It is constructive for very short time frames but fragile if higher time frames reassert their downtrend.
Bollinger Bands: mid $78.67, upper $81.80, lower $75.55
Price is holding slightly above the mid-band on M15. The band structure shows reversion toward the mean rather than fresh trending behavior. For intraday execution, dips into the mid-band (~$78.5–79) that hold could serve as bounce zones, while rejection near the upper band (~$81.8) would mark the edge of this small relief move.
ATR (14): $1.01
With a 15‑minute ATR around $1, short-term swings of about 1–1.5% per bar are common. That is still noisy, but much more manageable than the daily shock. Execution-wise, this supports tactical trades with defined levels, provided one respects the broader bearish daily context.
15‑minute Pivot Levels:
Pivot point (PP): $79.76
Resistance R1: $80.23
Support S1: $79.28
Price is resting right at the M15 pivot, with a tight micro range between S1 (~$79.3) and R1 (~$80.2). This is short-term balance after stress. A clean break above R1 that holds would support a push back toward the hourly resistance band; a drop below S1 that sticks would show that the bounce is running out of steam.
15‑minute takeaway: Execution time frame is neutral to mildly constructive, showing the first leg of a potential short-covering bounce, but it exists entirely inside a much larger bearish framework.
Main scenario for Solana price: bearish with room for a reflex rally
The daily trend sets the tone: main scenario is bearish for Solana price. The asset is trading in a clear downtrend below all major EMAs, and daily MACD is still decisively negative. That is your structural backdrop.
At the same time, daily RSI in the low 20s, price pressed against the lower Bollinger Band, and stabilizing signals on H1 and M15 all point to conditions ripe for a short-term relief rally or at least a consolidation phase. So the dominant narrative is:
- Macro: bearish trend, driven by risk-off sentiment, heavy crypto-wide deleveraging, and extreme fear.
- Micro: short-term stabilization, with intraday traders probing for bounces and shorts beginning to manage risk.
These two forces can coexist: price can bounce hard inside a bear trend and still be structurally weak.
Clear bullish and bearish paths for Solana price
Bullish scenario (countertrend rally / bottoming attempt)
In the bullish path, the short-term stabilization on H1 and M15 turns into a stronger mean-reversion move.
- What bulls need to see:
- On M15/H1, Solana price holds above the local pivots (~$79.7) and stops making new intraday lows.
- H1 RSI pushes above 50 and MACD completes a clean bullish cross with a widening positive histogram.
- Price reclaims and holds above the H1 20‑EMA (~$81.5), then attacks the $85 region (daily R1 and H1 resistance zone).
- On D1, price closes back inside the Bollinger Bands and starts moving toward the mid-band (~$115) over time.
- Upside scope in this scenario:Initially, the realistic target is the $85–90 band (prior intraday resistance plus hourly upper band area). If the broader market stabilizes and Solana price can build higher lows above ~$80, an extended mean reversion toward the daily 20‑EMA around $110 becomes technically plausible. That move would still be a bear-market rally unless the 20‑day EMA is reclaimed and defended.
- What would invalidate the bullish case:A decisive break and daily close below $71 (daily S1), especially on rising volume, would signal that the selling wave is not done. That would undercut the entire mean-reversion thesis and reset the downside, likely triggering another leg of forced liquidations.
Bearish scenario (continuation of the downtrend)
In the bearish path, current stabilization is just a pause before another drop.
- What bears want to see:
- H1 and M15 fail to hold the local pivots, with Solana price slipping back below $78.8 (H1 S1) and $79.3 (M15 S1) and staying there.
- H1 RSI rolls back down from the low‑40s toward oversold without making a higher high, confirming trend continuation rather than repair.
- Daily MACD stays negative and the histogram does not significantly contract, keeping macro momentum pointed down.
- Price continues to ride or close below the daily lower Bollinger Band, indicating that forced selling remains in play.
- Downside scope in this scenario:First, a test and potential break of the $71 area (daily S1). If that goes, the market will be trading in an air pocket where historical support is thin, and volatility, already high, could spike again. With daily ATR around $9.6, another $10–15 extension lower in a stress event is not out of the question.
- What would invalidate the bearish case:If Solana price can reclaim and hold above the H1 50‑EMA (~$87), then later close the day back above the daily 20‑EMA (~$110), the character of this move changes. That would mark a structural improvement, suggesting that the selloff was a shakeout rather than the start of a deeper bear phase. Bears lose their clear trend-following edge in that environment.
How to think about positioning, risk, and uncertainty
Solana price is sitting in a zone where trend traders and mean‑reversion traders see very different pictures:
- Trend and swing traders looking at the daily chart see a clear broken uptrend, with price below all major EMAs, negative MACD, and heavy market-wide risk-off.
- Short-term traders on H1 and M15 see oversold conditions stabilizing, with the potential for a sharp squeeze if shorts become too crowded or if the broader market bounces.
Both can be right over their respective horizons. The key variables now are:
- Volatility: Daily ATR near $10 and hourly ATR near $3.5 mean position sizing and stop placement need to assume wide swings. Small misjudgments in entry and exit can be amplified.
- Market regime: A total crypto market cap drop of ~7.5% and an Extreme Fear reading of 9 are textbook deleveraging conditions. Liquidity can vanish quickly both ways, down on forced selling and up on sudden short squeezes.
- Time frame alignment: The daily remains bearish while intraday is merely stabilizing. Until those time frames align on the upside, Solana price rallies are statistically more likely to be countertrend bounces within a broader downtrend.
In this environment, clarity comes from respecting the dominant daily bear trend while acknowledging that short, violent rallies are increasingly likely as the market becomes more oversold. Traders who ignore the volatility and the regime risk are effectively betting on clean, linear moves in a market that is anything but calm right now.


You May Also Like

Solana Crisis Deepens As 20 Protocols Confirm Exposure To $285M Drift Hack

USDC Deposits Spike To $778M—Largest Since Bitcoin ATH


