

Bitcoin Enters Structural Reset as Trend Indicators Signal Prolonged Weakness
Bitcoin is undergoing a broad structural reset as recent price action continues to reflect weakening momentum and cautious market behavior.
After months of elevated volatility and aggressive upside expansion, the market has shifted into a corrective phase marked by declining trend strength, subdued participation, and deteriorating sentiment. Technical indicators derived from Binance data suggest that the current move is less about short-term noise and more about a recalibration of market structure.
Price has continued to drift lower following its October 2025 peak near $126,000, leaving Bitcoin down roughly 46% from cycle highs.
Historically, drawdowns of this magnitude have often marked extended reset phases within broader market cycles, as reflected in long-term on-chain and market cycle data from Glassnode. As price action weakens, broader market psychology has also shifted, reinforcing a defensive posture across the crypto market.
Trend Structure Reflects Ongoing Repricing Phase
Data from the Bitcoin Trend Strength & Structure Index on Binance highlights a market that is struggling to re-establish directional conviction. Price is currently trading below its 50-day moving average, which sits in the mid-$80,000 range, while remaining well below the 200-day moving average near $100,000. The widening distance between these two trend markers underscores the degree of structural damage sustained during the recent decline.
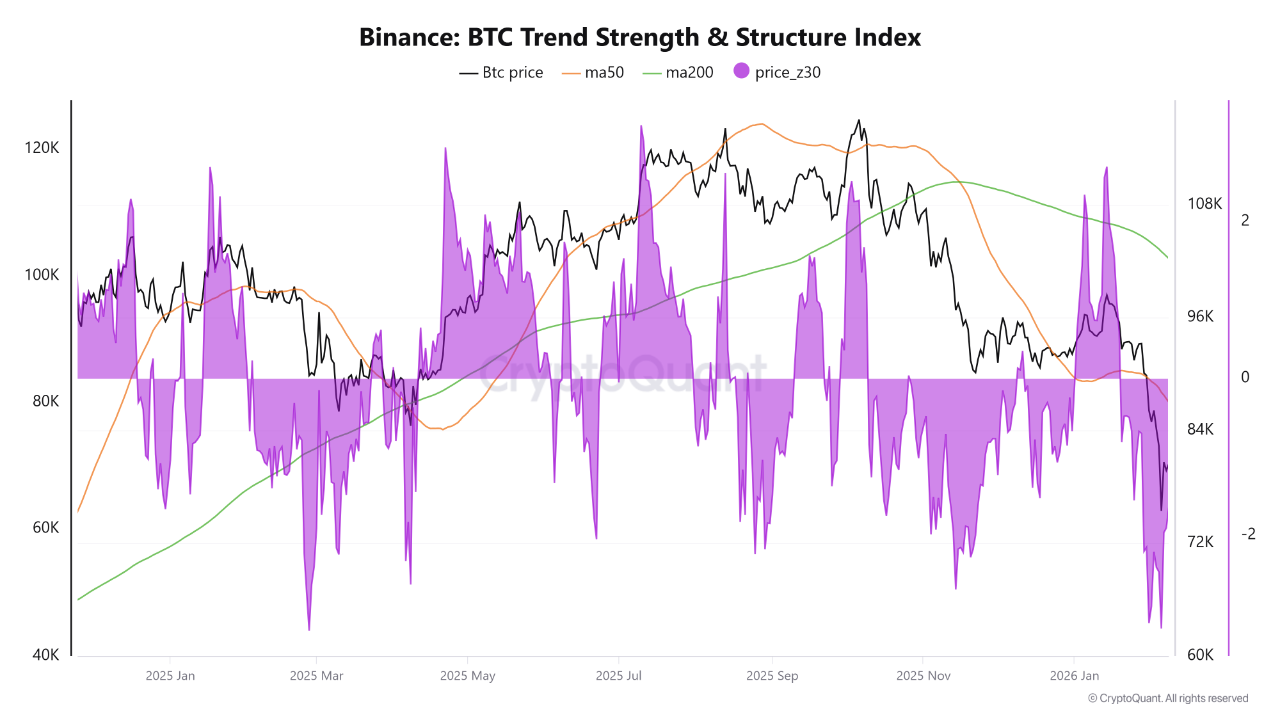 Source: https://cryptoquant.com/insights/quicktake/6989fa2163d8c42764424b61-Binance-Data-Indicates-Structural-Weakness-in-Bitcoins-Trend-as-Price-Falls-Belo
This configuration is typically associated with a repricing or consolidation phase rather than an imminent trend reversal. In such environments, markets often rotate from momentum-driven behavior toward range-bound price discovery, as participants reassess fair value following a prolonged rally. Rather than aggressively chasing upside, traders tend to reduce exposure and wait for clearer confirmation that downside risks have stabilized.
The inability to reclaim the short-term moving average reinforces the view that bullish momentum has faded for now. Historically, sustained recoveries have required not only a move back above the 50-day average, but also evidence that price can hold those levels amid improving liquidity and participation.
Statistical Measures Point to Mean Reversion Pressure
Beyond traditional trend indicators, statistical positioning also reflects growing downside pressure. The price Z-score, which measures how far price deviates from its medium-term statistical mean, has slipped into negative territory near -1.6. This suggests that Bitcoin is trading meaningfully below its recent average, a condition that often coincides with trend exhaustion and declining leverage appetite.
Periods where the Z-score remains negative for extended durations have historically aligned with phases of market digestion rather than immediate rebounds. These environments tend to flush out weaker positioning while encouraging a more selective approach to risk. Instead of sharp V-shaped recoveries, price action often evolves through choppy ranges as market participants gradually rebuild confidence.
Sentiment Hits Extreme Fear as Risk Appetite Collapses
Market sentiment has deteriorated in parallel with weakening technicals. The Crypto Fear & Greed Index recently fell to a reading of 9, placing it firmly in “Extreme Fear” territory. Notably, this represents the lowest sentiment reading since the aftermath of the 2022 FTX collapse.
Such levels reflect a sharp contraction in risk appetite, particularly among short-term traders and retail participants. Elevated fear readings typically coincide with reduced leverage, lower trading volumes, and heightened sensitivity to negative price movements. While extreme fear does not imply immediate downside continuation, it does signal that confidence remains fragile and that participants are prioritizing capital preservation.
Liquidity Conditions Remain Fragile
Liquidity dynamics further support a cautious outlook. Order book depth has thinned, and follow-through on upside attempts remains limited. Relief rallies have struggled to gain traction, suggesting that buyers are not yet willing to commit meaningful capital without stronger confirmation of trend recovery.
This lack of conviction is consistent with broader macro uncertainty and reinforces Bitcoin’s role as a sentiment barometer for the wider crypto market. Until liquidity conditions improve and participation broadens, price action is likely to remain reactive rather than directional.
What the Market Is Watching Next
Looking ahead, traders and investors appear focused on structural signals rather than short-term price fluctuations. Key conditions that would suggest a shift in market dynamics include price stabilizing above the 50-day moving average, narrowing spreads between short- and long-term trend indicators, and a gradual improvement in sentiment metrics.
Absent these developments, expectations remain centered on consolidation and volatility rather than trend acceleration. In this context, Bitcoin continues to act less as a driver of speculative appetite and more as a reflection of broader risk conditions.
Until confidence returns and structural indicators begin to realign, Bitcoin’s current phase is best viewed as a reset rather than a failure. For now, the market remains in observation mode, with participants waiting for clearer signals before committing to the next directional move.
The post Bitcoin Enters Structural Reset as Trend Indicators Signal Prolonged Weakness appeared first on ETHNews.
You May Also Like

Urgent Probe Demanded By Senator Warren Over Chinese Mining Hardware Threats

US Senator Warren probes China-based Bitmain on security concerns


