The post BitMine Stock Risks 40% Drop — Tom Lee’s Strategy to Blame? appeared on BitcoinEthereumNews.com. BitMine Immersion Technologies is entering a high-riskThe post BitMine Stock Risks 40% Drop — Tom Lee’s Strategy to Blame? appeared on BitcoinEthereumNews.com. BitMine Immersion Technologies is entering a high-risk

BitMine Stock Risks 40% Drop — Tom Lee’s Strategy to Blame?

For feedback or concerns regarding this content, please contact us at crypto.news@mexc.com

BitMine Immersion Technologies is entering a high-risk phase as paper losses on its Ethereum holdings continue to deepen. The stock has failed to hold recent rebounds, while both technical and crypto-linked signals point to weakening conviction.

As of February 10, BitMine’s total invested capital stood at nearly $15 billion. Its current portfolio value has dropped to about $7.7 billion.

This means nearly 49% of its investment value has been wiped out, on paper. At the same time, Ethereum trades near $1,950, while BitMine’s realized cost basis sits around $3,850. With ETH priced almost 50% below the average buy level, most holdings remain deeply underwater.

Sponsored

Sponsored

Cost-Basis Losses and Hidden Divergence Signal Rising Sell Pressure

BitMine’s biggest weakness is its shrinking margin of safety.

The realized price shows where the company accumulated most of its Ethereum. When the market price stays far below this level, companies are under pressure to cut exposure.

Want more token insights like this? Sign up for Editor Harsh Notariya’s Daily Crypto Newsletter here.

BitMine’s Investment In Red: CryptoQuant

Current data shows:

  • Average ETH cost basis: $3,850
  • Current ETH price: $1,950
  • Unrealized loss: 49%
Cost Basis Risk Grows: CryptoQuant

This puts BitMine in a vulnerable position. Technical signals reinforce this risk.

Sponsored

Sponsored

Between November 18 and February 9, BMNR formed lower highs on the daily chart, while the Relative Strength Index made higher highs. RSI tracks momentum by measuring buying and selling strength. When price makes lower highs, and RSI makes higher highs, it forms a hidden bearish divergence. This shows weakening momentum beneath the surface.

RSI Flashes BMNR Price Risk: TradingView

Soon after this divergence appeared, selling resumed. BMNR had rebounded nearly 26% from January lows. But the rally failed to hold and is now at risk of a pullback, led by divergence and rising cost-basis pressure.

Weak Money Flow and Crossover Risk Show Fading Confidence

Big money shows early signs of hesitation. Chaikin Money Flow, or CMF, tracks whether large investors are accumulating or distributing. Values above zero usually signal buying. Values below zero suggest selling pressure.

Between late November and early February, CMF trended up despite falling prices. This showed some long-term support, which remains. But even during the recent 26% rebound, CMF failed to break above its falling trendline. It also failed to make new highs and even go above the zero line. This means the rally lacked strong backing from big wallets, and the current trend still leans toward big-money exits.

Sponsored

Sponsored

Big Money Still Not Convinced: TradingView

Moving averages add another warning. The 100-day Exponential Moving Average (EMA) is now approaching the 200-day EMA. An Exponential Moving Average (EMA) gives more weight to recent prices, making it useful for spotting early trend shifts.

When shorter-term averages move below longer ones, it often signals deeper weakness. Earlier, on January 27, a bearish (death) crossover occurred when the 50-day EMA fell below the 200-day EMA. After that signal, BMNR dropped over 44%.

Crossover Risk: TradingView

If another bearish crossover forms, downside pressure could accelerate, even if it isn’t as impactful as the death crossover. This risk increases if Ethereum remains weak. BMNR still shows moderate correlation with ETH near 0.5.

BitMine Stock-ETH Correlation: Portfolio Slab

Sponsored

Sponsored

Continued ETH weakness could directly weigh on the stock.

Key BitMine Stock Levels Show Where the Next Breakdown Could Begin

With cost-basis losses growing, the BitMine stock price structure now becomes critical. The most important short-term support sits near $17, slightly over 10% from the current levels. This level has acted as a base during recent consolidation.

If BMNR loses $17, downside momentum could increase sharply.

Below this zone, the next support appears near $15. If that fails, Fibonacci projections point toward $11, which marks the 0.618 retracement level, a historically strong level. A move toward $11 would represent an additional downside of more than 40% from current levels.

On the upside, recovery remains difficult. The BitMine stock price must reclaim $21 to ease immediate pressure. This level aligns with prior resistance.

BMNR Price Analysis: TradingView

Only above $21 would the short-term structure begin to improve. A further move toward $26 would require stronger Ethereum prices and renewed big money demand. At present, both remain uncertain. As long as ETH trades far below BitMine’s cost basis and money flows weaken, rebounds are likely to face heavy selling.

Source: https://beincrypto.com/bitmine-stock-cost-basis-risk-analysis/

Market Opportunity
Ethereum Logo
Ethereum Price(ETH)
$2,095.74
$2,095.74$2,095.74
-1.48%
USD
Ethereum (ETH) Live Price Chart

AI Strategy: Powered 24/7

AI Strategy: Powered 24/7AI Strategy: Powered 24/7

Generate automated strategies using natural language

Disclaimer: The articles reposted on this site are sourced from public platforms and are provided for informational purposes only. They do not necessarily reflect the views of MEXC. All rights remain with the original authors. If you believe any content infringes on third-party rights, please contact crypto.news@mexc.com for removal. MEXC makes no guarantees regarding the accuracy, completeness, or timeliness of the content and is not responsible for any actions taken based on the information provided. The content does not constitute financial, legal, or other professional advice, nor should it be considered a recommendation or endorsement by MEXC.

You May Also Like

Ethereum koers toont zeldzaam dubbel koopsignaal en richt zich op $4.550

Ethereum koers toont zeldzaam dubbel koopsignaal en richt zich op $4.550

Connect met Like-minded Crypto Enthusiasts! Connect op Discord! Check onze Discord   Ethereum laat op de uurgrafiek twee opeenvolgende TD Sequential koopsignalen zien. Deze indicator meet uitputting in een trend en geeft vaak een signaal dat de verkoopdruk kan afnemen. Dit dubbele signaal verschijnt rond het niveau van $4.516, waar de ETH prijs kortstondig steun vindt. Dit type formatie komt zelden voor en wordt daarom extra nauwlettend gevolgd. Wat gaat de Ethereum koers hiermee doen? Ethereum koers test steun rond $4.516 De scherpe daling van de Ethereum koers vanaf de prijszone rond $4.800 bracht de ETH prijs in korte tijd naar ongeveer $4.516. Op dit niveau trad duidelijke koopactiviteit op, waardoor de neerwaartse beweging tijdelijk werd gestopt. Het dubbele signaal dat door de TD Sequential indicator is gegenereerd, viel precies samen met dit prijspunt. De TD Sequential is opgebouwd uit negen candles die een trend meetellen. Wanneer de negende candle verschijnt, kan dit duiden op een trendomslag. In dit geval verschenen zelfs twee signalen kort na elkaar, wat aangeeft dat de verkoopdruk mogelijk uitgeput is. Het feit dat dit gebeurde in een zone waar ETH kopers actief bleven, maakt het patroon extra opvallend. TD Sequential just flashed two buy signals for Ethereum $ETH! pic.twitter.com/JPO8EhiEPi — Ali (@ali_charts) September 16, 2025 Welke crypto nu kopen?Lees onze uitgebreide gids en leer welke crypto nu kopen verstandig kan zijn! Welke crypto nu kopen? Fed-voorzitter Jerome Powell heeft aangekondigd dat de rentes binnenkort zomaar eens omlaag zouden kunnen gaan, en tegelijkertijd blijft BlackRock volop crypto kopen, en dus lijkt de markt klaar om te gaan stijgen. Eén vraag komt telkens terug: welke crypto moet je nu kopen? In dit artikel bespreken we de munten die… Continue reading Ethereum koers toont zeldzaam dubbel koopsignaal en richt zich op $4.550 document.addEventListener('DOMContentLoaded', function() { var screenWidth = window.innerWidth; var excerpts = document.querySelectorAll('.lees-ook-description'); excerpts.forEach(function(description) { var excerpt = description.getAttribute('data-description'); var wordLimit = screenWidth wordLimit) { var trimmedDescription = excerpt.split(' ').slice(0, wordLimit).join(' ') + '...'; description.textContent = trimmedDescription; } }); }); Technische indicatoren schetsen herstelkans voor ETH Naast de dubbele koopsignalen verstrekken ook andere indicatoren belangrijke aanwijzingen. Tijdens de daling van de ETH koers waren grote rode candles zichtbaar, maar na de test van $4.516 stabiliseerde de Ethereum koers. Dit wijst op een mogelijke verschuiving in het evenwicht tussen de bears en bulls. Als deze opwaartse beweging doorzet, liggen de eerste weerstanden rond $4.550. Daarboven wacht een sterkere zone rond $4.650. Deze niveaus zijn in eerdere Ethereum sessies al meerdere keren getest. Een doorbraak zou ruimte openen richting de all-time high van ETH rond $4.953. Wanneer de prijs toch opnieuw onder $4.516 zakt, liggen er zones rond $4.500 en $4.450 waar grotere kooporders worden verwacht. Deze niveaus kunnen als een vangnet fungeren, mocht de druk opnieuw toenemen. Marktdynamiek bevestigt technische indicatoren De huidige situatie volgt op een bredere correctie in de cryptomarkt. Verschillende vooraanstaande crypto tokens zagen scherpe koersdalingen, waarna traders op zoek gingen naar signalen voor een mogelijke ommekeer. Dat juist Ethereum nu een dubbel TD Sequential signaal toont, versterkt de interesse in dit scenario. Fundamenteel blijft Ethereum sterk. Het aantal ETH tokens dat via staking is vastgezet, blijft groeien. Dat verkleint de vrije circulatie en vermindert verkoopdruk. Tegelijk blijft het netwerk intensief gebruikt voor DeFi, NFT’s en stablecoins. Deze activiteiten zorgen voor een stabiele vraag naar ETH, ook wanneer de prijs tijdelijk onder druk staat. Fundamentele drijfveren achter de Ethereum koers De Ethereum koers wordt echter niet alleen bepaald door candles en patronen, maar ook door bredere factoren. Een stijgend percentage van de totale ETH supply staat vast in staking contracten. Hierdoor neemt de liquiditeit op exchanges af. Dit kan prijsschommelingen versterken wanneer er plotseling meer koopdruk ontstaat. Daarnaast is Ethereum nog steeds het grootste smart contract platform. Nieuwe standaarden zoals ERC-8004 en ontwikkelingen rond layer-2 oplossingen houden de activiteit hoog. Deze technologische vooruitgang kan de waardepropositie ondersteunen en zo indirect bijdragen aan een ETH prijsherstel. Het belang van de korte termijn dynamiek De komende handelsdagen zullen duidelijk maken of de bulls genoeg kracht hebben om door de weerstandszone rond $4.550 te breken. Voor de bears ligt de focus juist op het verdedigen van de prijsregio rond $4.516. De whales, die met grote handelsorders opereren, kunnen hierin een beslissende rol spelen. Het dubbele TD Sequential signaal blijft hoe dan ook een zeldzame gebeurtenis. Voor cryptoanalisten vormt het een objectief aanknopingspunt om de kracht van de huidige Ethereum trend te toetsen. Vooruitblik op de ETH koers Ethereum liet twee opeenvolgende TD Sequential signalen zien op de uurgrafiek, iets wat zelden voorkomt. Deze formatie viel samen met steun rond $4.516, waar de bulls actief werden. Als de Ethereum koers boven dit niveau blijft, kan er ruimte ontstaan richting $4.550 en mogelijk $4.650. Zakt de prijs toch opnieuw onder $4.516, dan komen $4.500 en $4.450 in beeld als nieuwe steunzones. De combinatie van zeldzame indicatoren en een sterke fundamentele basis maakt Ethereum interessant voor zowel technische als fundamentele analyses. Of de bulls het momentum echt kunnen overnemen, zal blijken zodra de Ethereum koers de eerstvolgende weerstanden opnieuw test. Koop je crypto via Best Wallet Best wallet is een topklasse crypto wallet waarmee je anoniem crypto kan kopen. Met meer dan 60 chains gesupport kan je al je main crypto coins aanschaffen via Best Wallet. Best wallet - betrouwbare en anonieme wallet Best wallet - betrouwbare en anonieme wallet Meer dan 60 chains beschikbaar voor alle crypto Vroege toegang tot nieuwe projecten Hoge staking belongingen Lage transactiekosten Best wallet review Koop nu via Best Wallet Let op: cryptocurrency is een zeer volatiele en ongereguleerde investering. Doe je eigen onderzoek. Het bericht Ethereum koers toont zeldzaam dubbel koopsignaal en richt zich op $4.550 is geschreven door Dirk van Haaster en verscheen als eerst op Bitcoinmagazine.nl.
Share
Coinstats2025/09/17 23:31
Binance Perpetual Futures Revolution: QQQ and Major US Stocks Enter Crypto Derivatives Market with 10x Leverage

Binance Perpetual Futures Revolution: QQQ and Major US Stocks Enter Crypto Derivatives Market with 10x Leverage

BitcoinWorld Binance Perpetual Futures Revolution: QQQ and Major US Stocks Enter Crypto Derivatives Market with 10x Leverage In a groundbreaking move that bridges
Share
bitcoinworld2026/04/02 18:00
Franklin Templeton CEO Dismisses 50bps Rate Cut Ahead FOMC

Franklin Templeton CEO Dismisses 50bps Rate Cut Ahead FOMC

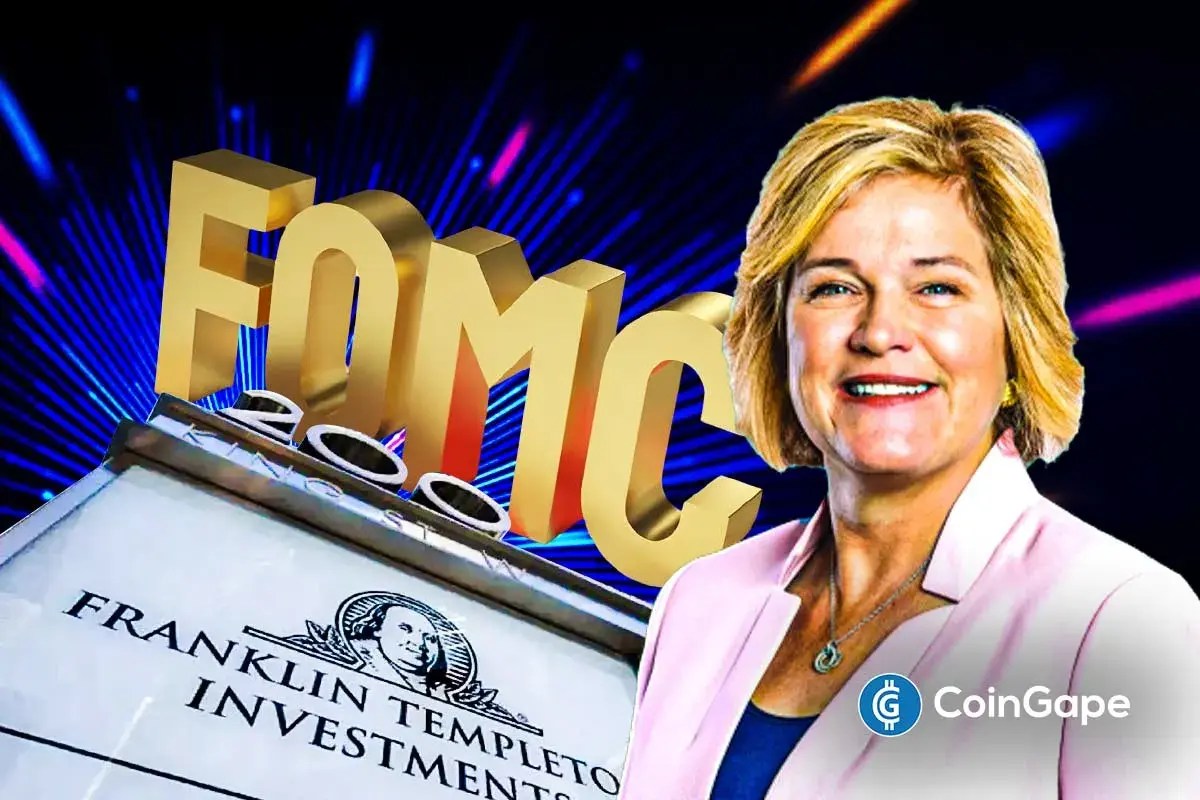
The post Franklin Templeton CEO Dismisses 50bps Rate Cut Ahead FOMC appeared on BitcoinEthereumNews.com. Franklin Templeton CEO Jenny Johnson has weighed in on whether the Federal Reserve should make a 25 basis points (bps) Fed rate cut or 50 bps cut. This comes ahead of the Fed decision today at today’s FOMC meeting, with the market pricing in a 25 bps cut. Bitcoin and the broader crypto market are currently trading flat ahead of the rate cut decision. Franklin Templeton CEO Weighs In On Potential FOMC Decision In a CNBC interview, Jenny Johnson said that she expects the Fed to make a 25 bps cut today instead of a 50 bps cut. She acknowledged the jobs data, which suggested that the labor market is weakening. However, she noted that this data is backward-looking, indicating that it doesn’t show the current state of the economy. She alluded to the wage growth, which she remarked is an indication of a robust labor market. She added that retail sales are up and that consumers are still spending, despite inflation being sticky at 3%, which makes a case for why the FOMC should opt against a 50-basis-point Fed rate cut. In line with this, the Franklin Templeton CEO said that she would go with a 25 bps rate cut if she were Jerome Powell. She remarked that the Fed still has the October and December FOMC meetings to make further cuts if the incoming data warrants it. Johnson also asserted that the data show a robust economy. However, she noted that there can’t be an argument for no Fed rate cut since Powell already signaled at Jackson Hole that they were likely to lower interest rates at this meeting due to concerns over a weakening labor market. Notably, her comment comes as experts argue for both sides on why the Fed should make a 25 bps cut or…
Share
BitcoinEthereumNews2025/09/18 00:36

No Chart Skills? Still Profit

No Chart Skills? Still ProfitNo Chart Skills? Still Profit

Copy top traders in 3s with auto trading!