PIPPIN price has shot up nearly 200% over the past week, driven by sharp demand from futures traders. Is the meme coin set to see more gains, or will it crash? PIPPIN price has shot up nearly 200% over the past week, driven by sharp demand from futures traders. Is the meme coin set to see more gains, or will it crash?

Will PIPPIN price crash after rallying 200% this week?

2026/02/12 17:31
3 min read

PIPPIN price has shot up nearly 200% over the past week, driven by sharp demand from futures traders. Is the meme coin set to see more gains, or will it crash?

Summary
  • PIPPIN price rallied 200% over the past week, primarily driven by a spike in speculative trading.
  • The meme coin has confirmed a rounded bottom pattern on the daily chart.

According to data from crypto.news, the Pippin (PIPPIN) price rallied over 200% in the past 7 days to a high of $0.52, which is roughly 7% short of breaking past its previous all-time high of $0.55 hit last month.

The PIPPIN rally appears to be mostly fueled by increased speculative activity, as traders aggressively opened bullish positions in the derivatives market, a trend common among high-volatility meme coins where momentum is often driven by leverage rather than fundamental developments.

Data from CoinGlass shows that PIPPIN futures open interest has jumped to an all-time high of $217 million, nearly four times the amount recorded nearly a week ago. At the same time, the long/short ratio stood above 1, suggesting more investors were betting on further price increases.

Open Interest reflects the total number of outstanding derivative contracts that have not been settled. When a surge in Open Interest comes along with the price rise of an asset, it indicates new money entering the market.

Meanwhile, the aggregated funding rate was positive at press time at 0.0070%, which shows that long position holders were paying fees to short sellers, conditions that help support continued upward momentum.

It should, however, be noted that PIPPIN’s rally came without the backing of any major news or development from the project’s team. Its official X account has not posted anything since August last year. 

Despite this lack of official communication, the retail sentiment surrounding the token has remained bullish, as seen in CoinMarketCap.

Another point of concern is the market-wide downturn fueled by Bitcoin’s underperformance over the past trading sessions. Crypto investors are currently spooked by concerns over another U.S. government shutdown and uncertainty over Fed policy direction.

PIPPIN price analysis

On the daily chart, PIPPIN price appears to be forming the cup of a multi-week cup and handle pattern, which has been developing since late January. 

PIPPIN price has confirmed a rounded bottom pattern on the daily chart.

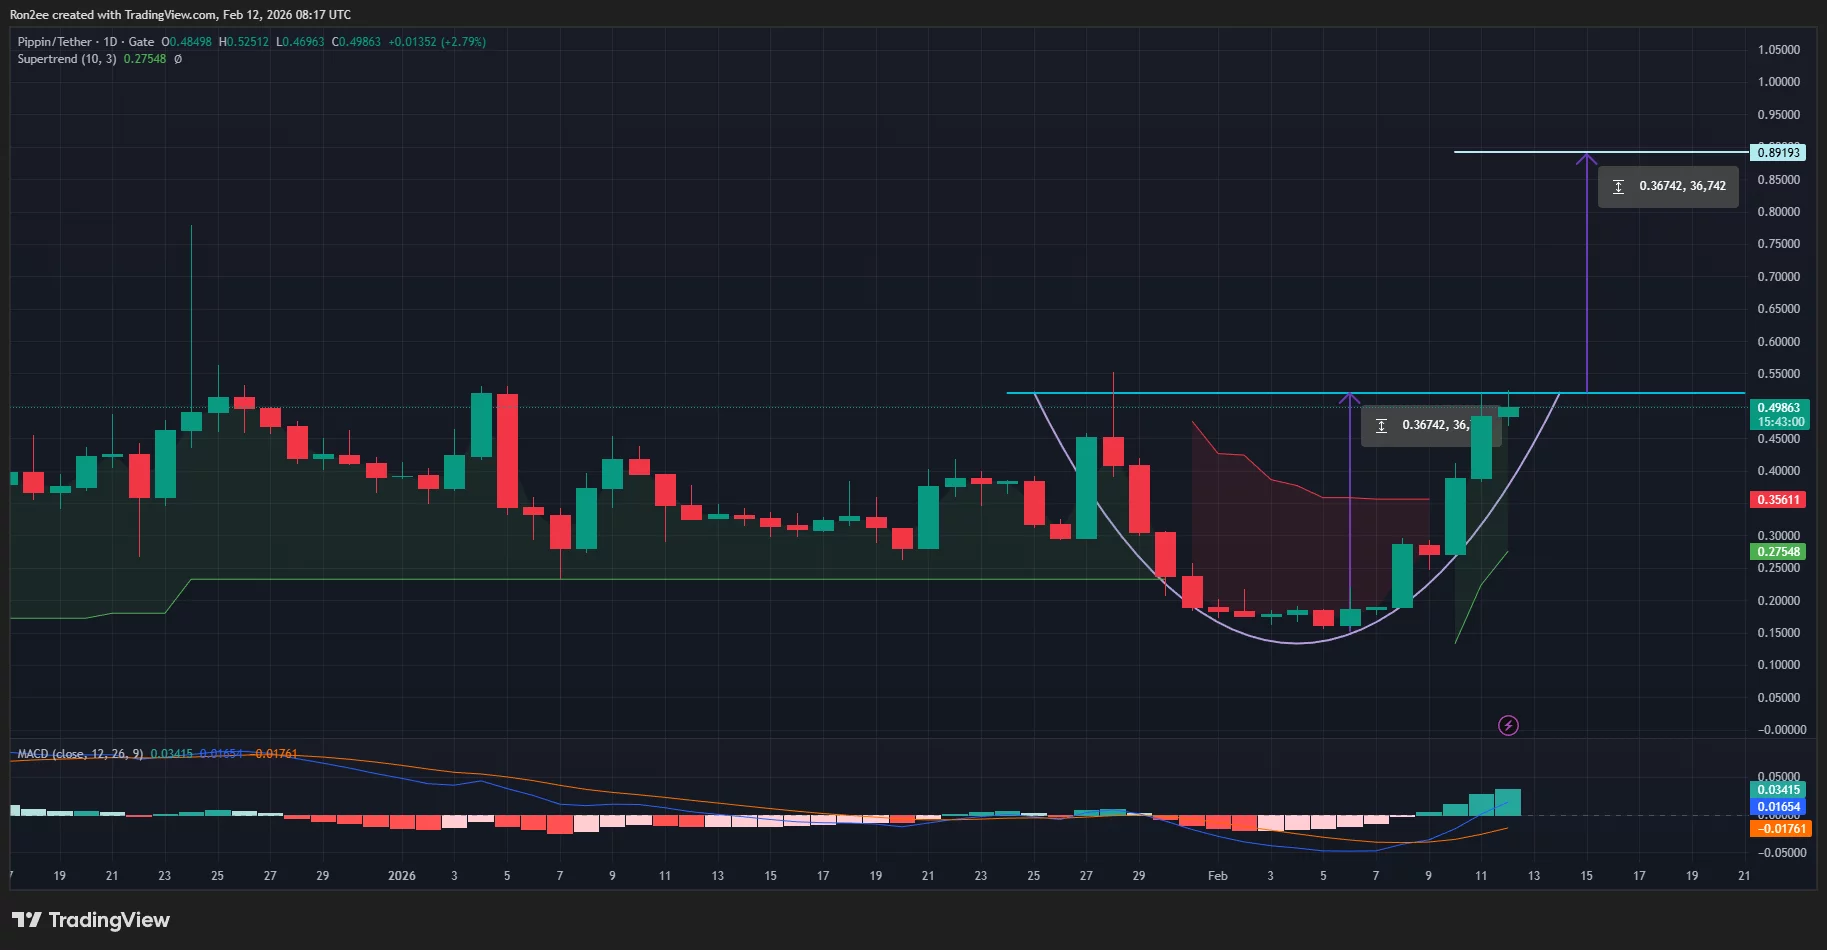
The cup and handle pattern is one of the most bullish continuation patterns that often signals an existing uptrend is likely to resume after a period of consolidation. The cup in itself is also formed of a rounded bottom pattern, which is yet another bullish indicator by itself.

At press time, the PIPPIN price had already broken above the neckline of the rounded bottom formed. 

Considering this, the Solana-based meme coin could likely continue to be in an uptrend, with the path of least resistance appearing to be a bullish move to new highs around $0.89, calculated by adding the height of the rounded bottom formed to the point at which the price crossed the neckline.

Looking at technical indicators also gives us a grounded view of such a bullish forecast. Notably, the supertrend indicator has flashed green while the MACD lines have pointed upwards, both signs that bulls still have significant control over the market price action.

Unless the current upward momentum is hampered by macroeconomic headwinds, PIPPIN’s technical breakout is expected to serve as a bullish catalyst.

Disclosure: This article does not represent investment advice. The content and materials featured on this page are for educational purposes only.

Market Opportunity
Pippin Logo
Pippin Price(PIPPIN)
$0.475309
$0.475309$0.475309
-4.37%
USD
Pippin (PIPPIN) Live Price Chart
Disclaimer: The articles reposted on this site are sourced from public platforms and are provided for informational purposes only. They do not necessarily reflect the views of MEXC. All rights remain with the original authors. If you believe any content infringes on third-party rights, please contact service@support.mexc.com for removal. MEXC makes no guarantees regarding the accuracy, completeness, or timeliness of the content and is not responsible for any actions taken based on the information provided. The content does not constitute financial, legal, or other professional advice, nor should it be considered a recommendation or endorsement by MEXC.

You May Also Like

UAE Launches First Regulated Stablecoin as ADI Trends Higher

UAE Launches First Regulated Stablecoin as ADI Trends Higher

The United Arab Emirates has officially launched its first regulated stablecoin, marking another step in the region’s expanding digital asset infrastructure. According
Share
Ethnews2026/02/13 00:23
The Ultimate Guide to Professional Dog Grooming: Choosing the Right Tools for a Salon-Finish at Home

The Ultimate Guide to Professional Dog Grooming: Choosing the Right Tools for a Salon-Finish at Home

Every dog owner knows that grooming is more than just a beauty routine—it is a vital part of your pet’s health and happiness. Whether you are a professional stylist
Share
Techbullion2026/02/13 00:17
BlackRock boosts AI and US equity exposure in $185 billion models

BlackRock boosts AI and US equity exposure in $185 billion models

The post BlackRock boosts AI and US equity exposure in $185 billion models appeared on BitcoinEthereumNews.com. BlackRock is steering $185 billion worth of model portfolios deeper into US stocks and artificial intelligence. The decision came this week as the asset manager adjusted its entire model suite, increasing its equity allocation and dumping exposure to international developed markets. The firm now sits 2% overweight on stocks, after money moved between several of its biggest exchange-traded funds. This wasn’t a slow shuffle. Billions flowed across multiple ETFs on Tuesday as BlackRock executed the realignment. The iShares S&P 100 ETF (OEF) alone brought in $3.4 billion, the largest single-day haul in its history. The iShares Core S&P 500 ETF (IVV) collected $2.3 billion, while the iShares US Equity Factor Rotation Active ETF (DYNF) added nearly $2 billion. The rebalancing triggered swift inflows and outflows that realigned investor exposure on the back of performance data and macroeconomic outlooks. BlackRock raises equities on strong US earnings The model updates come as BlackRock backs the rally in American stocks, fueled by strong earnings and optimism around rate cuts. In an investment letter obtained by Bloomberg, the firm said US companies have delivered 11% earnings growth since the third quarter of 2024. Meanwhile, earnings across other developed markets barely touched 2%. That gap helped push the decision to drop international holdings in favor of American ones. Michael Gates, lead portfolio manager for BlackRock’s Target Allocation ETF model portfolio suite, said the US market is the only one showing consistency in sales growth, profit delivery, and revisions in analyst forecasts. “The US equity market continues to stand alone in terms of earnings delivery, sales growth and sustainable trends in analyst estimates and revisions,” Michael wrote. He added that non-US developed markets lagged far behind, especially when it came to sales. This week’s changes reflect that position. The move was made ahead of the Federal…
Share
BitcoinEthereumNews2025/09/18 01:44