

Binance Coin Price: BNB Braces at $610 Support Inside a Deep Daily Downtrend

The current backdrop shows a heavy daily downtrend but also early signs of short-term stabilization for the Binance coin price around the $610–$615 area.
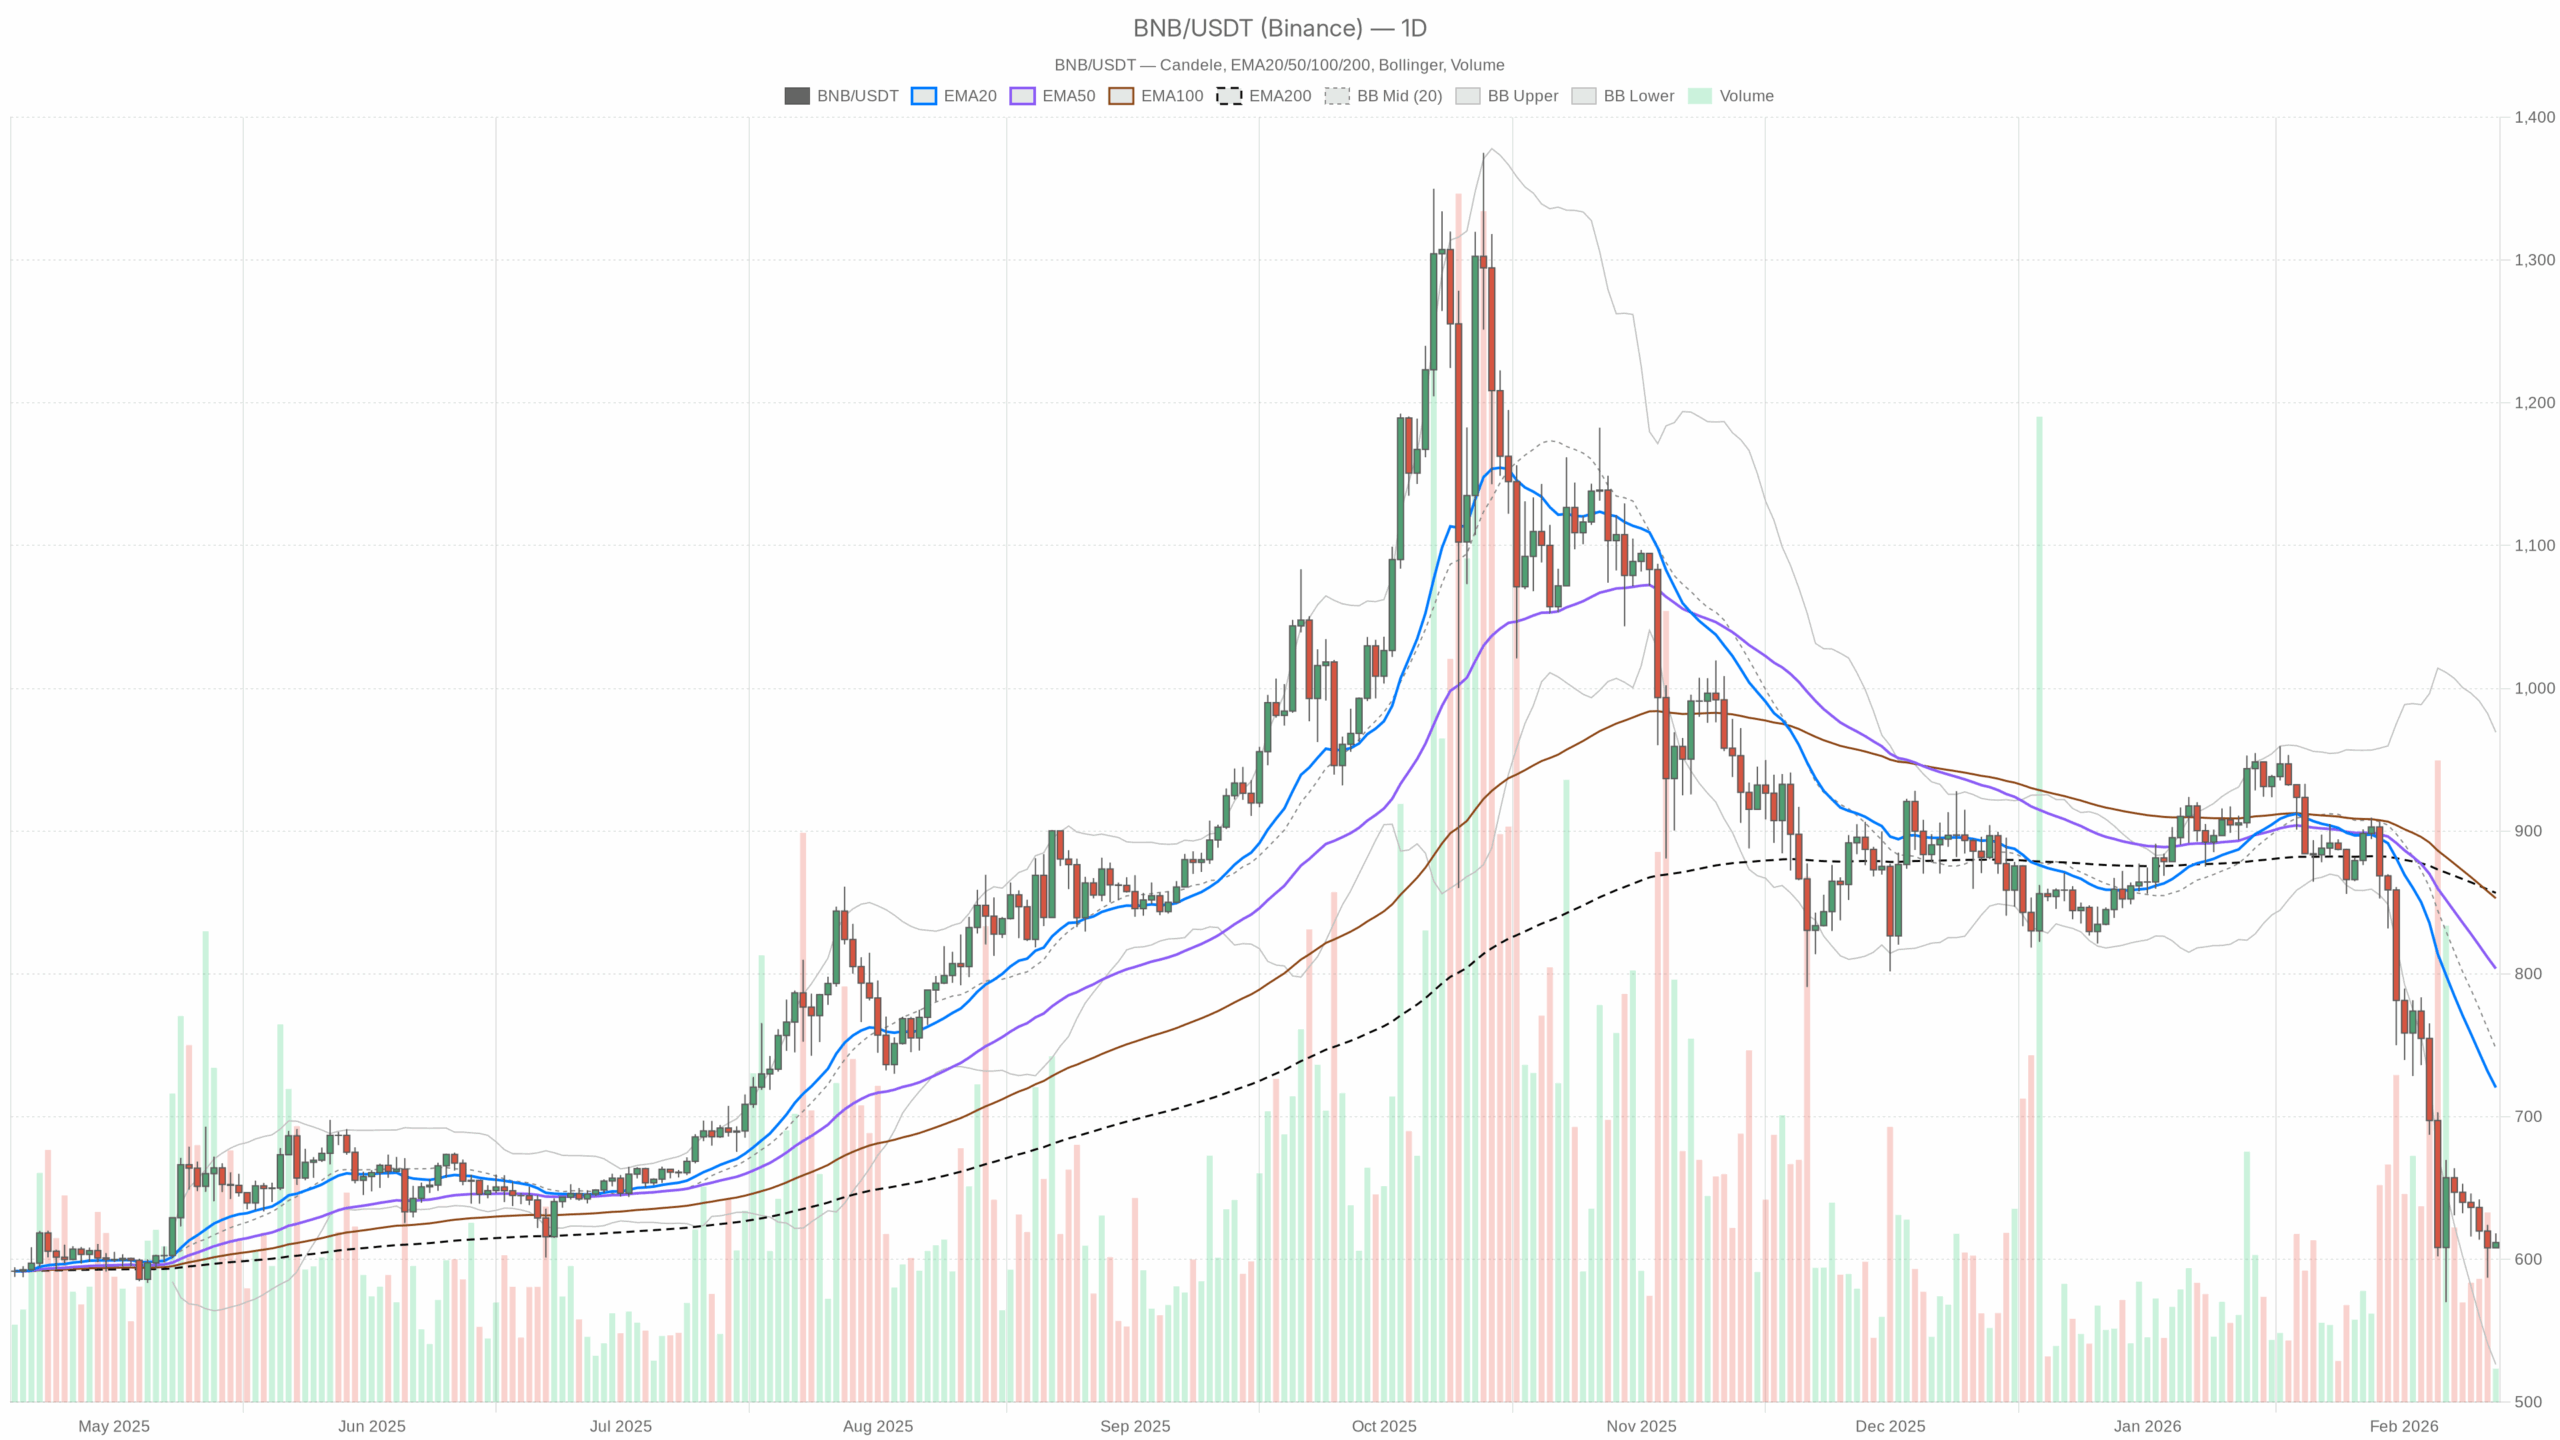 BNB/USDT — daily chart with candlesticks, EMA20/EMA50 and volume.
Binance Coin Price: A Brutal Daily Downtrend Meets Short-Term Stabilization
The Binance coin price (BNBUSDT) is trapped in a classic post-washout phase: the daily chart is heavily oversold and trending down, while intraday traders are quietly probing for a bounce around $610–$615. This matters because we are at the point where trends either extend into a capitulation leg or shift into a multi-week mean-reversion rally.
The dominant force right now is a strong daily downtrend with sentiment pinned at Extreme Fear (fear & greed index: 5). BTC dominance is high (around 56.5%), which usually means capital is defensive and clustered in bitcoin and major stables. In that environment, altcoins like BNB tend to lag and any bounce is guilty until proven otherwise.
On balance, the main scenario is bearish on the daily timeframe, with short-term (1H) price action moving into a neutral-to-slightly-constructive stance.
Daily Timeframe (D1): Strong Downtrend, Heavy Oversold, No Confirmed Reversal
Trend Structure & EMAs (D1)
Price vs EMAs:
BNB is trading around $611.81, far below the key daily EMAs:
- EMA 20: $720.39
- EMA 50: $803.68
- EMA 200: $856.71
Takeaway: Price is deeply below all major daily moving averages, with a clear bearish stack (price < 20 < 50 < 200). This is not just a downtrend; it is a mature, extended one. The distance from the 20-day EMA is wide enough to justify a relief rally. However, as long as BNB stays beneath roughly $720–$730, the broader structure remains decisively bearish.
RSI (D1)
RSI 14 (D1): 24.31
Takeaway: The daily RSI is deep in oversold territory. That often precedes short-term bounces or consolidation phases, but by itself it does not flip the trend. Right now, it mostly tells us that fresh shorts are late to the party. The easy downside portion of this leg has likely passed, but the market has not signaled any real demand yet.
MACD (D1)
MACD line: -72.89 • Signal: -60.18 • Histogram: -12.71
Takeaway: MACD is firmly negative with the line below the signal and the histogram still red. Momentum remains bearish, and we do not yet have the classic tell of a daily momentum reversal. There is no bullish cross and no sustained shrinking of the negative histogram. The selling pressure may be slowing somewhat, but the indicator still backs the dominant downtrend.
Bollinger Bands (D1)
BB mid: $747.79 • Upper: $969.23 • Lower: $526.36
Price: $611.81, sitting in the lower band region.
Takeaway: BNB is trading well below the middle band and closer to the lower band, consistent with a trend move lower rather than a simple sideways chop. There is room for price to test down into the low-$500s if selling escalates. That said, being this far below the mid-band also opens the door for a snapback toward $700+ if bears lose momentum.
ATR (D1)
ATR 14 (D1): $52.66
Takeaway: Daily volatility is elevated, with typical swings of roughly $50–$55 around current levels. That is material for position sizing. A trader trying to work with tight daily stops within 1–2% of spot will likely be whipsawed. The market is moving too much day-to-day for microscopic risk parameters.
Daily Pivot Levels (D1)
Pivot Point: $612.72
R1: $617.34 • S1: $607.20
Takeaway: Price is hovering right around the daily pivot area (about $612), with a relatively tight R1/S1 band. This tells you today’s battle line is basically where we are trading right now. A sustained hold above roughly $617 during the daily session would lean slightly in favor of a bounce. However, a firm break below about $607 would reopen room for another leg lower.
Daily Regime: explicitly tagged as bearish in the model, which aligns with the EMA stack and MACD but conflicts a bit with the deeply oversold RSI. That indicator is quietly hinting at mean reversion risk for shorts.
1-Hour Timeframe (H1): Short-Term Stabilization Inside a Macro Downtrend
On the hourly chart, the tone is more balanced. The model flags the regime as neutral, which is what you would expect when a strong daily trend pauses for breath.
Trend & EMAs (H1)
Price: $611.62
EMA 20: $610.87 • EMA 50: $614.13 • EMA 200: $656.23
Takeaway: On this timeframe, price is riding close to the 20 and 50 EMAs, slightly below the 50 but marginally above the 20. This is what a short-term basing or consolidation zone looks like after a heavy drop. However, the 200 EMA at around $656 is far above, keeping the medium-term structure bearish. Intraday, bulls have started to contest control, but they are still operating under a large overhead trend cap.
RSI (H1)
RSI 14 (H1): 51.13
Takeaway: RSI is near the middle of the range, showing neither strong buying nor strong selling intraday. This aligns with a market that is catching its breath. It is not capitulating, not ripping, just digesting prior losses. It is a clean, neutral backdrop from which either a bounce or a fresh push down can launch.
MACD (H1)
MACD line: 1.45 • Signal: 0.34 • Histogram: 1.11
Takeaway: The MACD on 1H has turned mildly positive, hinting that short-term momentum has shifted from outright selling to a tentative upward bias. It is not strong enough to claim a trend reversal, but it does show that bears no longer have total control of the intraday tape.
Bollinger Bands (H1)
BB mid: $608.62 • Upper: $622.88 • Lower: $594.35
Price: $611.62, trading just above the mid-band.
Takeaway: Price is slightly above the middle band, leaning toward the upper half of the range. That is consistent with a mild bullish intraday skew within a broader downtrend. As long as BNB holds above about $608, intraday participants can reasonably talk about a controlled consolidation rather than an ongoing flush.
ATR (H1)
ATR 14 (H1): $4.87
Takeaway: Hourly swings of roughly $5 per candle are normal right now. For short-term traders, that sets a practical minimum on stop distances. Anything much tighter risks getting clipped by ordinary noise.
Hourly Pivot Levels (H1)
Pivot Point: $612.84
R1: $614.82 • S1: $609.63
Takeaway: Price is sitting fractionally below the hourly pivot. The intraday tug-of-war is concentrated between roughly $610–$615. A clear push and hold over $615 on 1H closes would give the bounce narrative more credibility. However, repeated rejections there, followed by a break under $610, would suggest the market is preparing another leg lower.
15-Minute Timeframe (M15): Execution Zone, No Clear Edge Yet
The 15-minute chart is best treated as an execution lens, not a source of macro bias. The regime here is also tagged as neutral.
Trend & EMAs (M15)
Price: $611.62
EMA 20: $614.05 • EMA 50: $612.28 • EMA 200: $614.06
Takeaway: On the very short term, price is slightly below the 20 and 200 EMAs and just under the 50 EMA. The cluster of EMAs around $612–$614 shows a tight local equilibrium where neither side has a strong intraday edge. For scalpers, the break away from this cluster often marks the next impulse move, up or down.
RSI (M15)
RSI 14 (M15): 43.84
Takeaway: Short-term RSI is modestly below neutral, which leans slightly bearish but is not an extreme reading. It lines up with the idea that after a tiny intraday bounce, sellers are quietly testing the waters again.
MACD (M15)
MACD line: 0.03 • Signal: 0.72 • Histogram: -0.69
Takeaway: The MACD line has slipped below the signal on the 15-minute chart, with a negative histogram. Very short-term momentum is tilting back toward the downside. Combined with the slightly weak RSI, this warns that lower timeframes are starting to align with the overarching daily bearish bias again, even as the 1H remains relatively balanced.
Bollinger Bands (M15)
BB mid: $614.74 • Upper: $618.53 • Lower: $610.95
Price: $611.62, near the lower band.
Takeaway: Price has migrated toward the lower intraday band. That is consistent with an attempt to roll over in the very short term. If price starts closing below the lower band on this timeframe, it will often precede a shove down to clean out local liquidity pockets.
ATR & Pivot (M15)
ATR 14 (M15): $2.02
Pivot Point: $611.52 • R1: $612.19 • S1: $610.95
Takeaway: Micro swings are about $2 per 15-minute candle, with pivots packed tightly around the current price. For active traders, fades and breakouts around the $611–$612 area are where execution quality will make the difference.
Market Context: Defensive Capital, Extreme Fear
The broader crypto market cap sits around $2.37T, with a mild positive 24h change of +0.48%. BTC dominance at 56.5% shows capital crowding into bitcoin and away from higher-beta altcoins. The sentiment gauge is pinned at Extreme Fear (5), matching the technical picture of an oversold but distrustful market.
For BNB specifically, this means rallies will likely face profit-taking and skepticism until broader risk appetite returns. Even if BNB manages a technically driven bounce, it will be swimming upstream against a cautious macro backdrop.
Scenarios for Binance Coin Price (BNBUSDT)
Bullish Scenario
The bull case from here is a mean-reversion rally inside a larger downtrend.
Key elements:
- Daily RSI recovers from the low-20s toward neutral (40–50), signaling that the worst of the immediate selling pressure has passed.
- On the 1H chart, BNB holds above the pivot region (about $612–$615) and starts printing higher lows above $610.
- Price reclaims and sustains above the 1H 50 EMA (around $614) and then grinds toward the 1H 200 EMA (near $656).
- On D1, price starts to mean-revert toward the 20-day EMA around $720. That area becomes a natural first major upside target and resistance.
What would strengthen this scenario: a clear bullish cross and shrinking negative histogram on the daily MACD, combined with BNB closing multiple days back inside the lower half of the daily Bollinger channel (above roughly $650).
What invalidates the bullish case: a decisive breakdown below $600 on strong volume, with daily closes pressing toward or below the lower Bollinger band near the low-$500s. That would indicate the mean-reversion window has closed and the market has chosen another leg down instead.
Bearish Scenario (Main Scenario)
The base case, given the daily regime and structure, is that BNB remains in a bearish macro phase and is currently only pausing before either grinding lower or accelerating into a capitulation spike.
Key elements:
- Daily price stays trapped beneath the 20-day EMA (around $720), confirming that any rallies are being sold into.
- The short-term bounce attempts around $610–$615 fail, with 1H and 15m charts starting to trend lower together, showing lower highs below about $615.
- MACD on lower timeframes (15m and then 1H) rolls over more decisively, aligning with the already negative daily MACD.
- Price pushes through and closes below immediate supports around $607–$600, opening the path toward the daily lower Bollinger region around $530–$550.
What would strengthen this scenario: daily RSI staying depressed (sub-30) despite minor bounces, combined with an expanding negative daily MACD histogram and a refusal of price to reclaim even the 1H 200 EMA (near $656).
What invalidates the bearish case: a sustained reclaim of the daily 20 EMA (roughly $720+) coupled with improving daily momentum. That would mean MACD crossing higher and RSI breaking back above about 45–50. If BNB manages to close above that zone and hold it, the market would be signaling the end of the current downtrend leg and the start of a more meaningful repair phase.
Positioning, Risk, and How to Read This Tape
The Binance coin price is in a structurally bearish daily trend, but it is now so stretched and oversold that short-term plays become more about timing than about direction. Chasing new shorts purely off the daily chart is late. The better opportunities on the short side typically come after failed bounces into resistance, for example rejections between about $650–$720, not at the tail end of an already steep leg.
For bullish traders, the risk is assuming that oversold automatically means bottom. It often does not. In this kind of backdrop, the healthier upside trades usually wait for confirmation: higher lows on the 1H, a clean reclaim of intraday moving averages, and early signs of life on daily momentum, not just a single green candle off support.
Volatility is high on the daily (ATR in the $50s) and still meaningful intraday. Sizing and stop placement should reflect the reality that $20–$50 swings can occur without changing the bigger picture. The current tape rewards patience, flexibility, and respect for the dominant daily downtrend, while keeping an eye open for the first credible signs that mean reversion is finally starting to bite back into this market.
You May Also Like

Fed Decides On Interest Rates Today—Here’s What To Watch For
