

7-Year Death Cross Pattern Shows Bitcoin Likely to Bottom at $95K Then Shoot to $145K
Seven years’ worth of death cross data since the beginning of the 2017 bull run shows that Bitcoin might bottom around $95K before shooting for the stars at $145K.
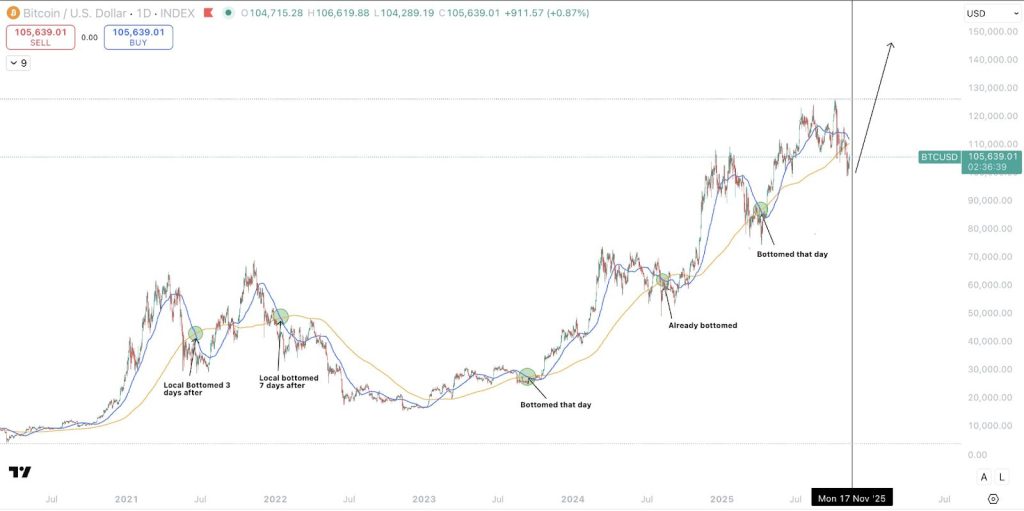
Bitcoin analyst Sykodelic observed that in the last 7+ years, every time the 1D 50SMA and 200SMA cross over to the downside, also known as “a death cross”, it has marked at least a local bottom within about 5 days, with at minimum a 45% rally afterwards.
According to him, “We are about to get the next death cross in about 5 days from now.”
Bitcoin’s Death Cross Nailed Every Bottom Since 2018
In 2018, the local bottom formed when the death cross occurred at $6,480, and the price went on to rally 50%.
Similarly, in March 2020, Bitcoin bottomed days before the death cross at $3,907, and the price went on to 17x to $68,000.
 Source: X/Sykodelic
Just recently, in April 2025, following the first tariff panic, Bitcoin dumped from the then-high of around $120K and bottomed out exactly on the day of the death cross formation around $74K.
The Bitcoin analyst confirmed that we are currently about 2 or 3 days away from it happening, which means that if the bottom is not in, we would expect it to be so by November 21st.
Sykodelic believes that if the price continues lower from here, the bottom target is $95K, but with a quick reversal.
However, in the near-term, he believes “Bitcoin is going to rally to at least $145,000 from here.”
Bitcoin has always bounced at least 50% from the local bottom after a death cross, and it is looking like it’d repeat that again as price still holds close to the 1W 50SMA with liquidity pointing to the upside.
“Even if you are in the belief that the market has topped and you want to exit, you don’t do it at the pico lows when the data is telling you that there will be a decent bounce at the very least.”
“The worst thing you can do in this game is sell the lows in panic,” Sykodelic advised crypto traders who believe the bull run is over.
Intel Data Flashes Same Bottom Signal That Preceded April’s 69% Rally
Data from CryptoQuant also supports the Bitcoin bottom formation observation.
Onchain data shows that there are now more than 5 million Bitcoins in loss, and the last time this happened was on April 7, before Bitcoin went on a 69% rally to new highs.
On April 7, 2025, when 1 BTC traded for $74,508, the amount of Bitcoin lost was exactly 5,159,000.
Recently, on November 5, 2025, when Bitcoin dipped to $98,966 for the first time since April, the amount of BTC in loss rose back to 5,639,000.
CoinCare market insight also revealed that the Bitcoin Net Unrealized Profit (NUP) is signaling a potential bottom.
Bitcoin NUP represents the total amount of unrealized profits held by investors whose coins are currently in profit.
Historically, during the bull cycle, short-term bottoms have formed whenever the NUP fell below 0.5.
 Source: CryptoQuant
Currently, the NUP is sitting at 0.476, indicating that Bitcoin might be approaching a short-term market bottom.
CoinCare analysts say, “We can expect a rebound in the near term.”
Technical Analysis
On the technical front, crypto chart analyst CryptoFabrik revealed that BTC is forming a falling wedge pattern on the 4H timeframe chart.
According to the structure, Bitcoin is likely to remain inside the wedge for the next few days, and a potential breakout can be expected next week.
Source: X/CryptoFabik
If Bitcoin manages to break out successfully, it could see a strong rally towards the $120K zone.


You May Also Like

How The Children’s Movie “Cars” Forewarns A Post-Human Era

Trump's reckoning may be coming as even his supporters question his competence: DC insider


