

WLFI price accumulates at $0.10 as oversold conditions hint at reversal
WLFI price is holding firm above the $0.10 support level as oversold indicators begin to unwind, increasing the probability of a relief bounce toward $0.13.
- WLFI is defending the $0.10 support with daily closes holding above
- RSI is recovering from oversold conditions, signaling easing downside pressure
- A relief rally toward $0.13 becomes more likely if support remains intact
World Liberty Financial (WLFI) price action is beginning to show early signs of stabilization after an extended period of downside pressure. The asset is currently testing a key support zone around $0.10, an area that carries technical significance due to its confluence with both the value area low and a prior swing low. This region has historically acted as a demand zone, and recent price behaviour suggests that buyers are once again stepping in to defend it.
As long as WLFI maintains acceptance above the $0.10 support, the technical outlook favors a corrective bounce rather than immediate continuation to the downside. This opens the probability for price to rotate higher toward the next major area of resistance near $0.13.
WLFI price key technical points
- $0.10 support holding firm: Confluence between value area low and prior swing low strengthens this demand zone
- RSI recovering from oversold conditions: Momentum is stabilizing after reclaiming the 30 level
- $0.13 resistance as upside target: Point of control aligns with high-timeframe resistance
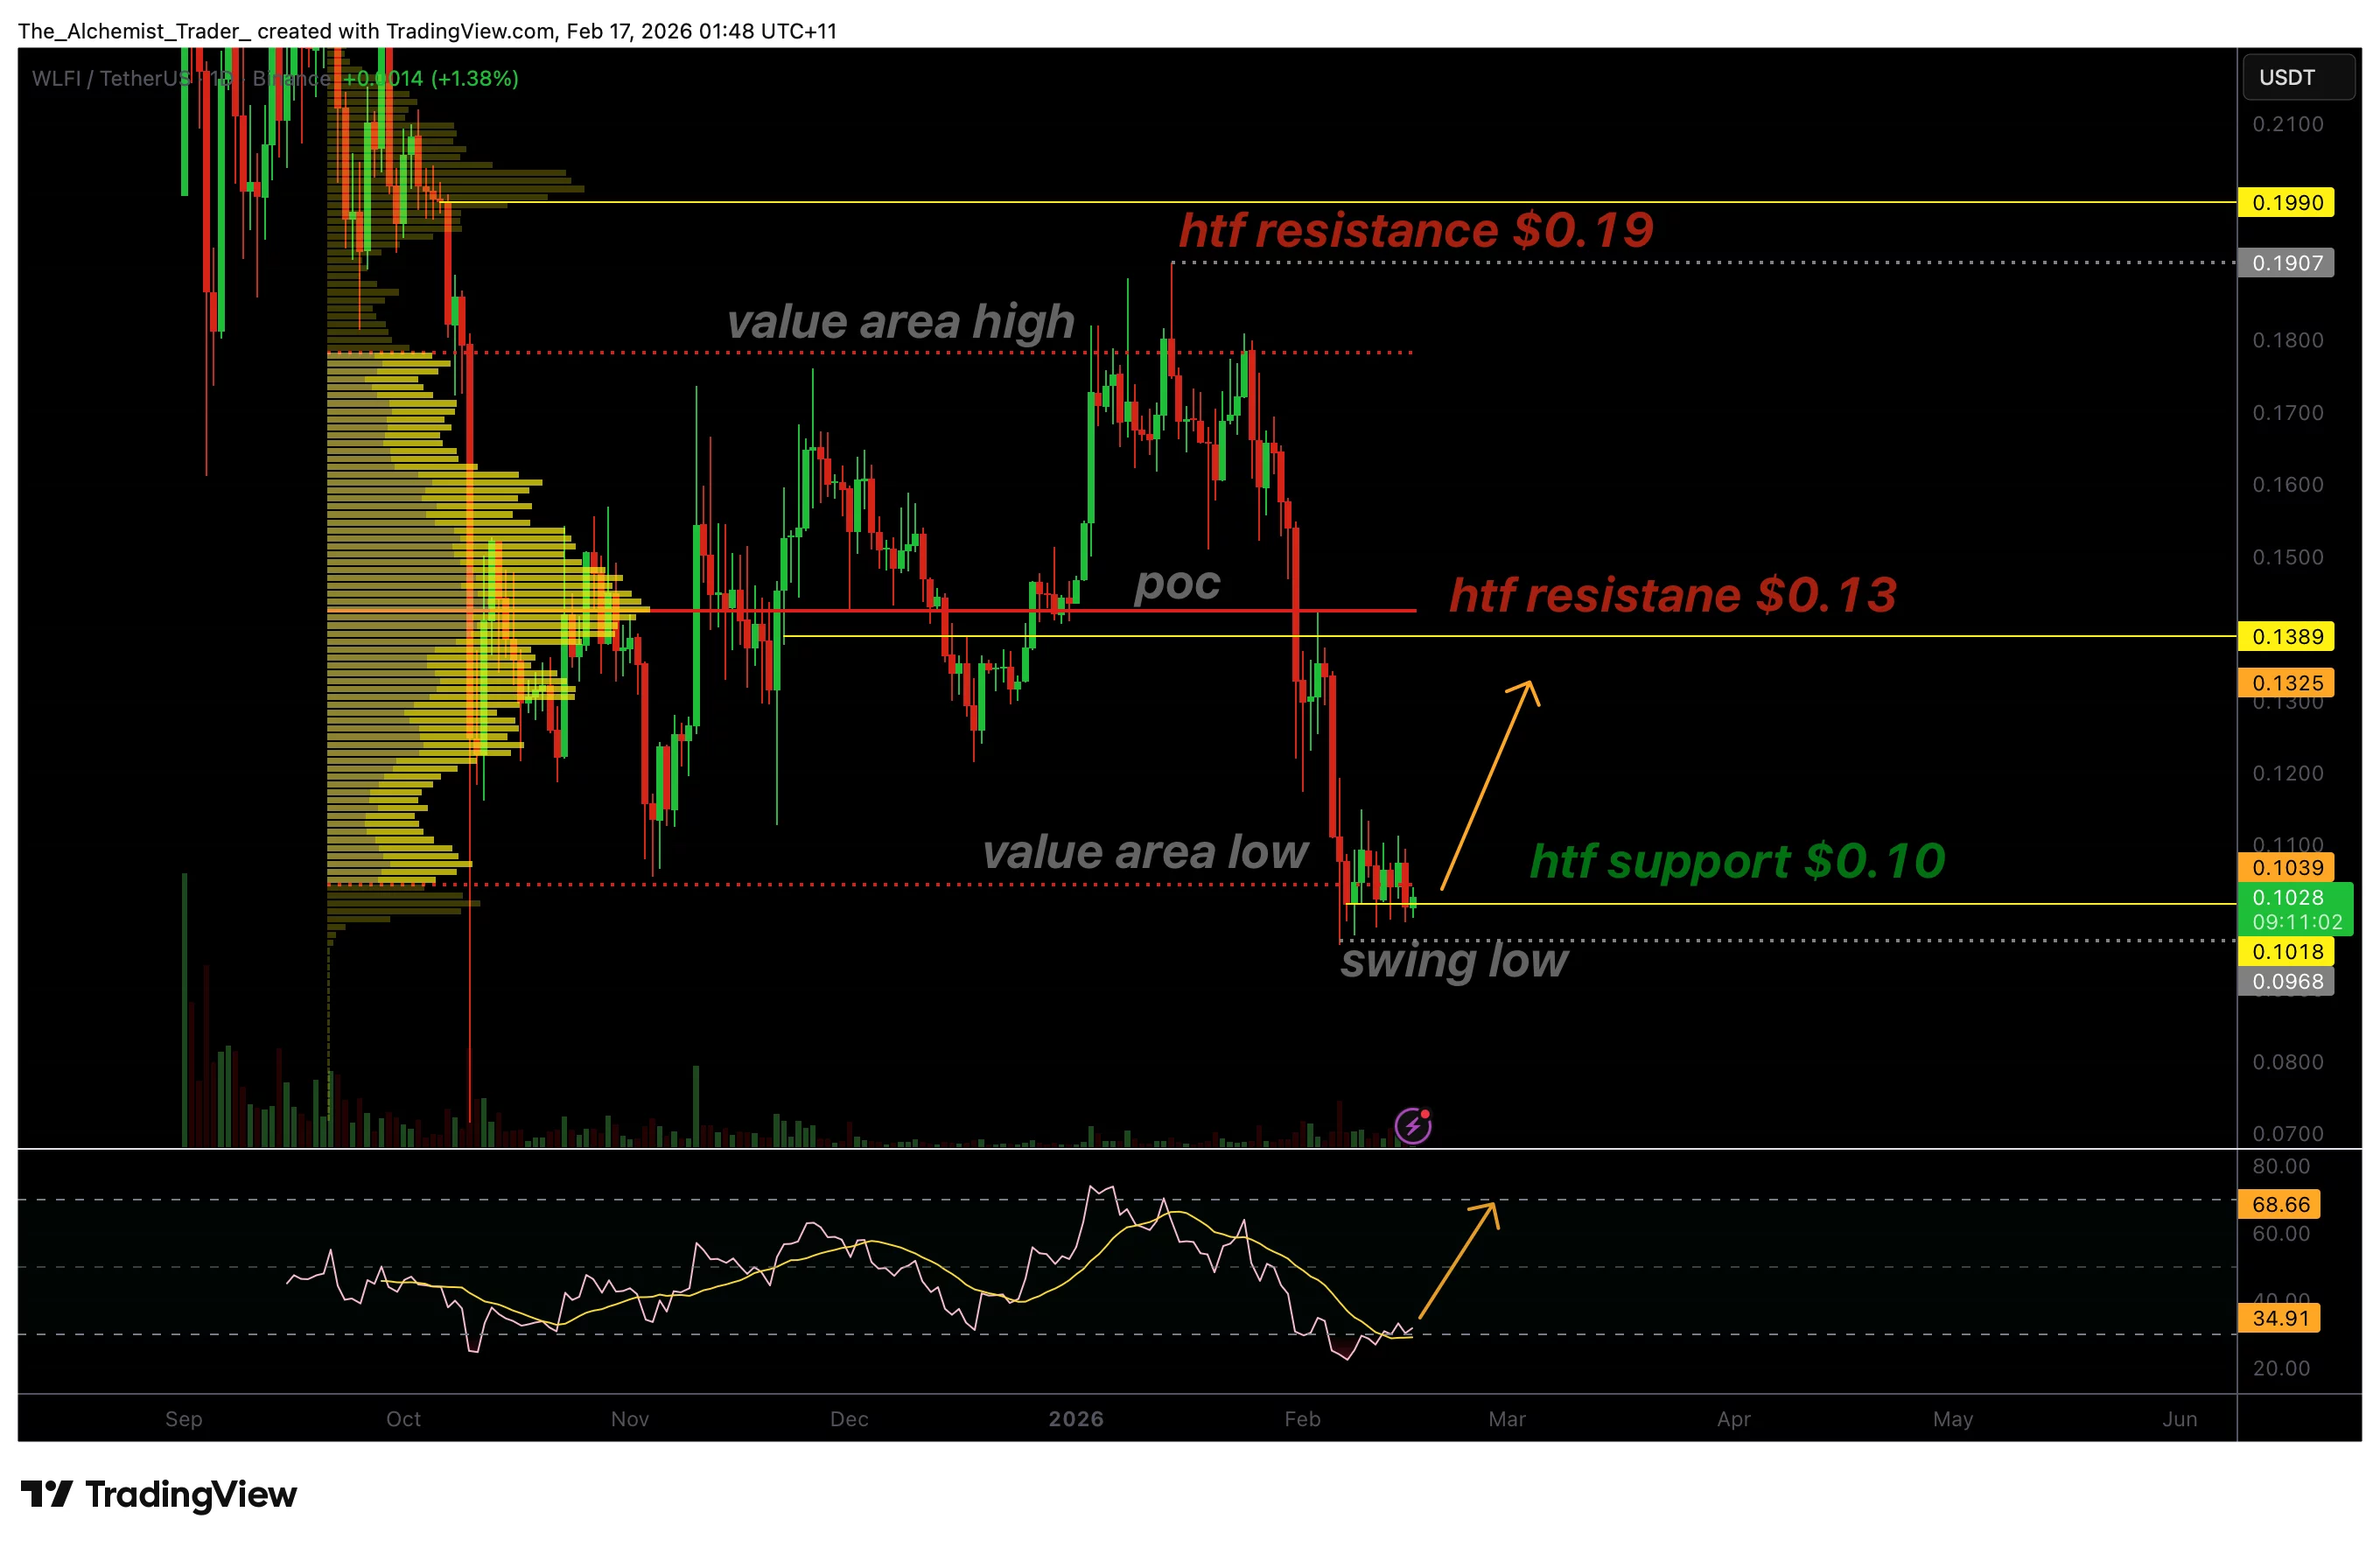
From a price action perspective, the $0.10 region is proving to be technically important. WLFI has repeatedly tested this level but has failed to produce sustained daily closes below it. Instead, price continues to find buyers willing to absorb sell-side liquidity, which is often indicative of accumulation rather than distribution.
Accumulation phases typically occur after impulsive sell-offs, when the price begins to stabilize and volatility contracts. This behavior suggests that market participants are positioning ahead of a potential relief move rather than exiting aggressively. The fact that daily candles are closing above support reinforces the idea that this zone is being defended with intent.
When support aligns with both structural levels and volume-based metrics such as the value area low, it increases the probability that price will hold. In WLFI’s case, this confluence strengthens the argument that $0.10 represents a meaningful short- to medium-term floor.
RSI recovery strengthens the case for a bounce
Momentum indicators are also beginning to support the bullish recovery thesis. The RSI recently dipped into extreme oversold territory below the 30 level, a condition that often precedes corrective rallies or mean reversion moves. More importantly, RSI has now reclaimed the 30 threshold, signaling that downside momentum is easing.
This type of RSI behavior typically coincides with price stabilization rather than trend continuation. As RSI recovers, it suggests that selling pressure is no longer dominant and that buyers are beginning to regain influence. A continued move higher in RSI toward neutral territory would further validate the potential for a price bounce.
If WLFI initiates a recovery move, RSI is likely to continue rising toward the 40–50 range, which would align with a relief rally rather than a full trend reversal. This supports the view that any upside move may initially be corrective.
$0.13 emerges as the next key resistance
On the upside, the $0.13 level stands out as the next major area of interest. This region aligns with a high-timeframe resistance zone and is reinforced by the point of control, where the highest volume of recent trading activity has occurred. Markets often gravitate toward these levels during corrective moves, as they represent areas of perceived fair value.
A rotation toward $0.13 would represent a healthy rebalancing of price following the recent sell-off. However, this level is also expected to attract supply, meaning the price may consolidate or react when it is reached. Acceptance above $0.13 would be required to shift the broader structure more decisively bullish.
Until then, the move toward this resistance should be viewed as a corrective bounce within a larger consolidation framework rather than a confirmed trend reversal.
What to expect in the coming price action
As long as Trump-backed World Liberty Financial remains above the $0.10 support level, the technical outlook favors a relief bounce toward the $0.13 resistance zone. Continued daily closes above support would further strengthen this scenario, as would RSI recovery.
However, a $0.10 loss would invalidate the accumulation thesis and reopen downside risk. Traders should monitor acceptance, momentum, and volume closely as the price reacts around these key levels.


You May Also Like

B.AI Integrates Deposit Support for HTX and WBTC Across Multiple Networks

Meta to Cut 8,000 Jobs as Zuckerberg Doubles Down on AI Expansion

SpaceX reveals Musk company links, from Cybertrucks and jets to stock investments


Trending News
More
