Bears Still Dominate Ethereum Crypto (ETHUSDT) As Selling Momentum Starts To Fade

After weeks of heavy downside, Ethereum crypto is showing early signs of seller fatigue even as the broader structure stays clearly bearish.
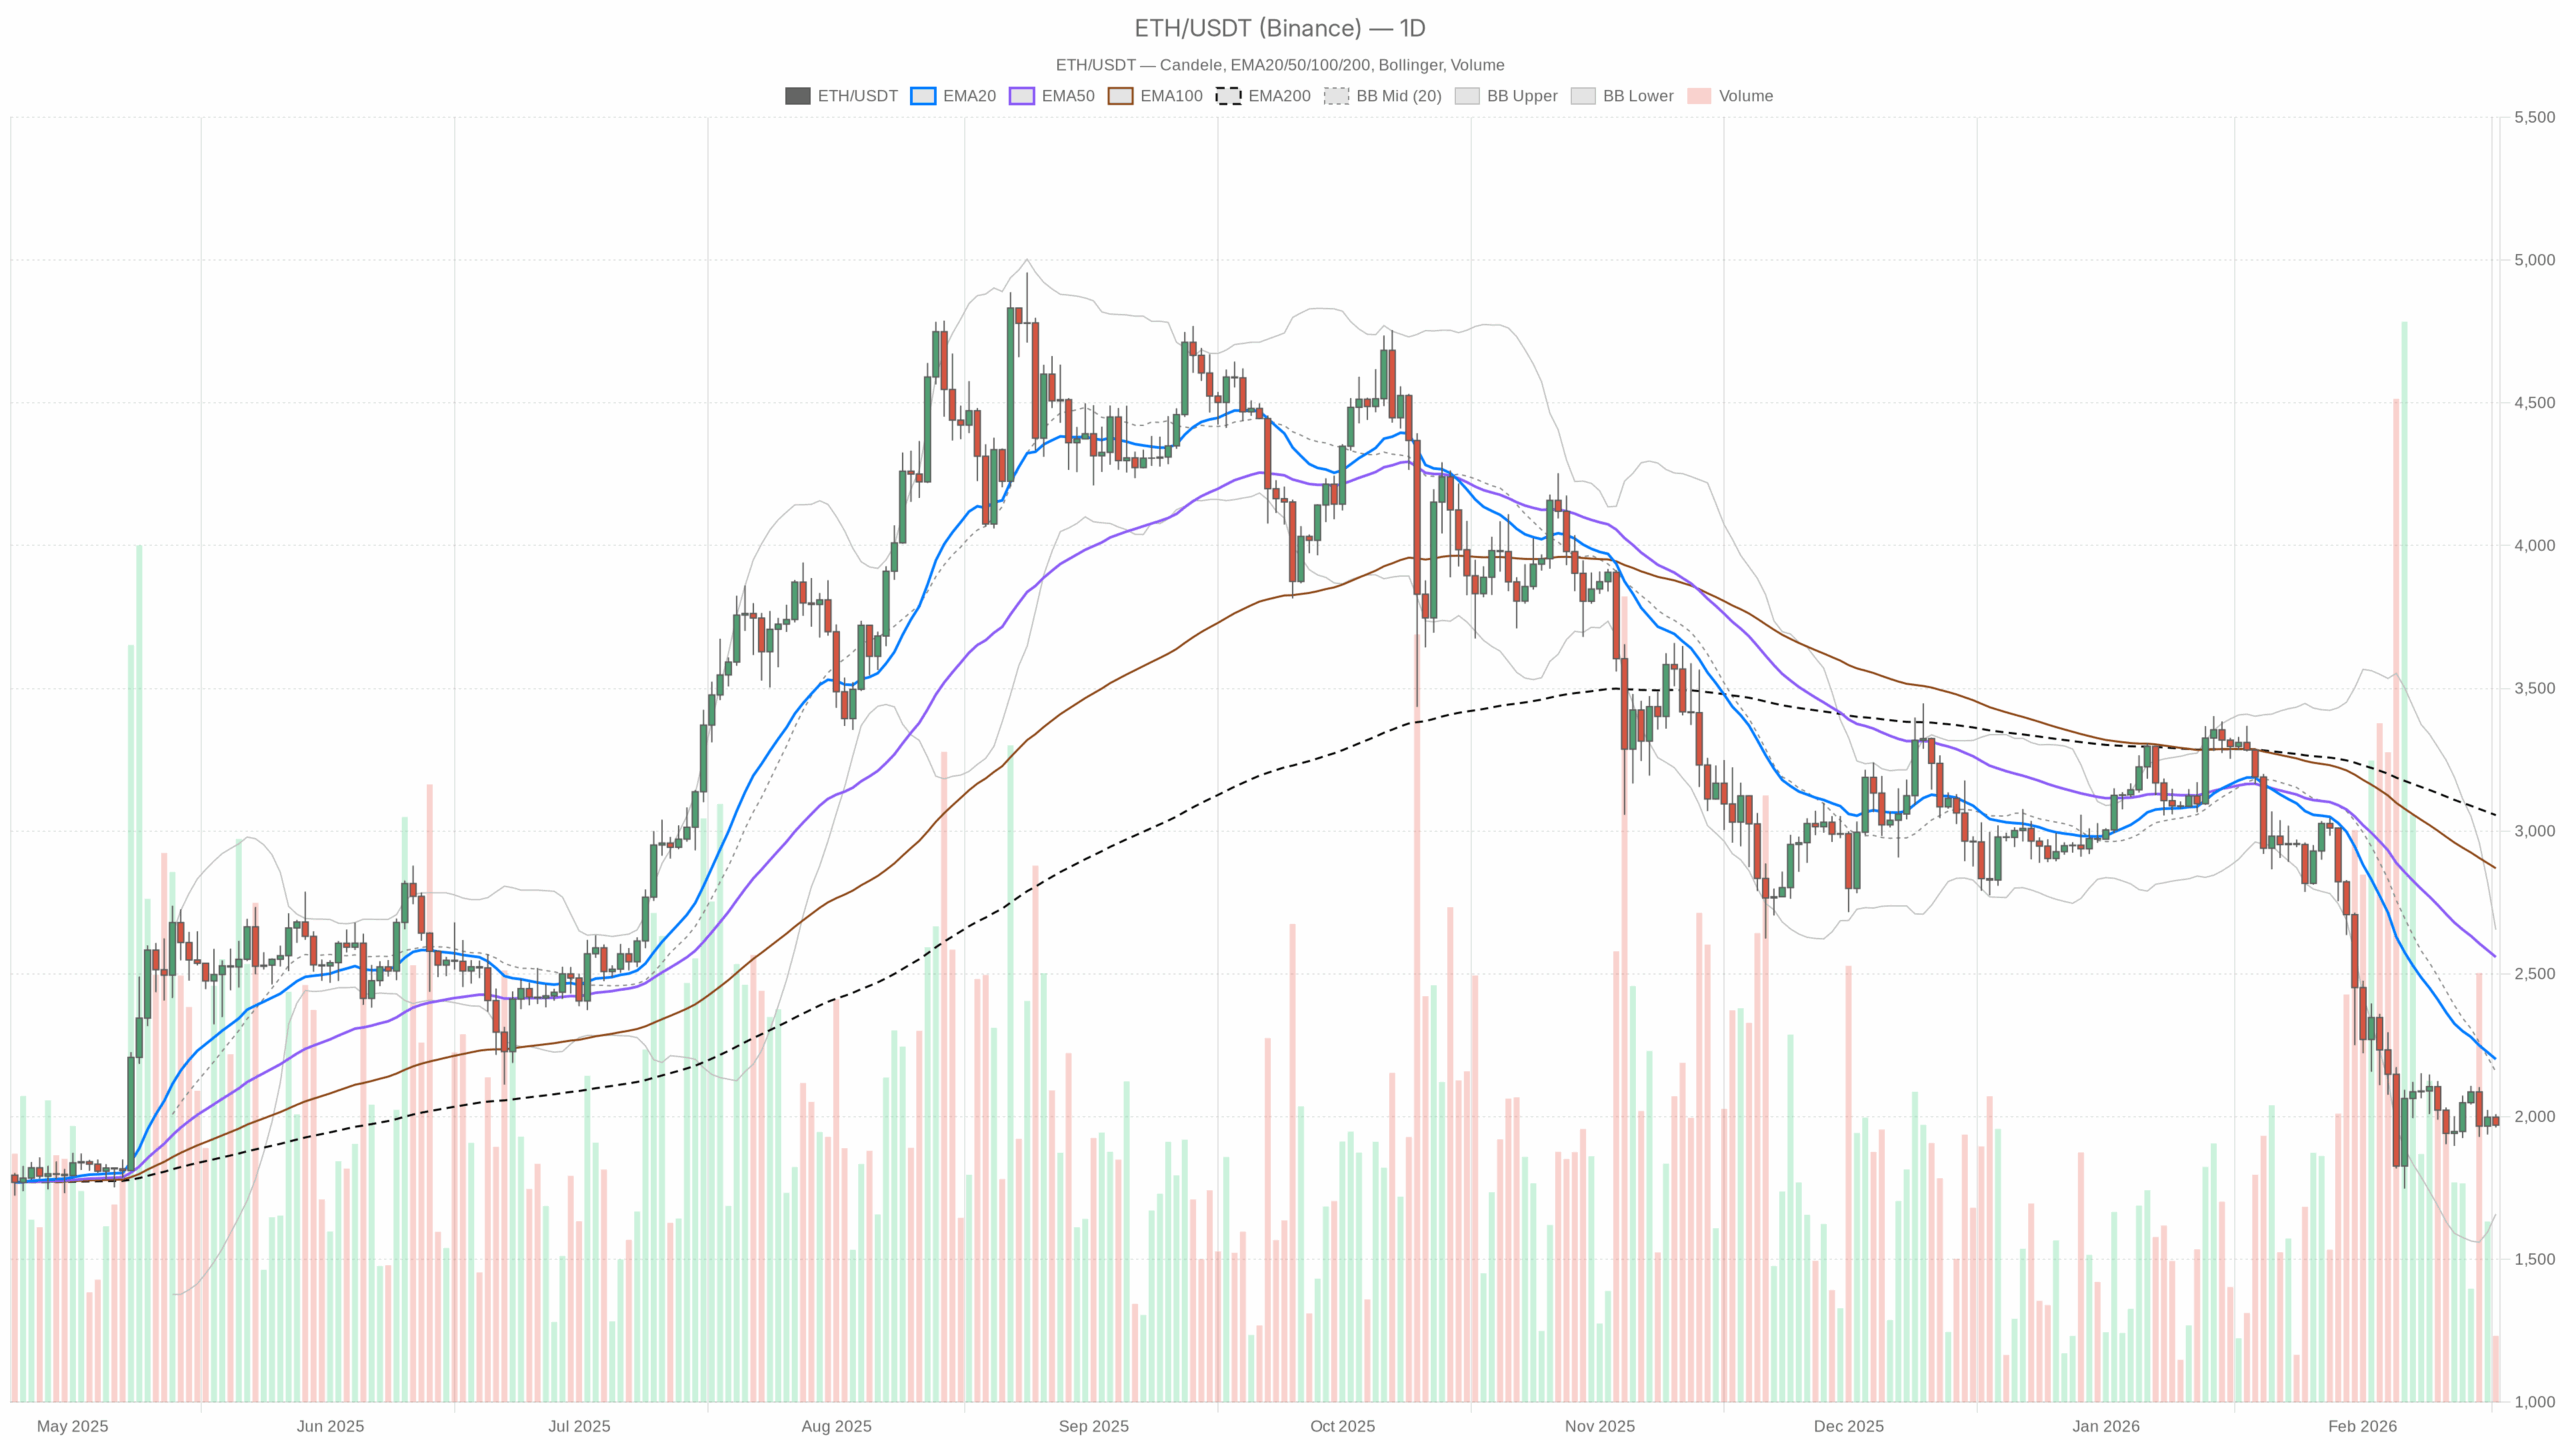 ETH/USDT — daily chart with candlesticks, EMA20/EMA50 and volume.
Market Thesis: Macro Still Down, But Pressure Is Easing
Ethereum crypto (ETHUSDT) is trading around $1,970, firmly below all key daily moving averages and well under the midline of its Bollinger Bands. The higher timeframe structure is clearly bearish: this is a market that has been sold hard and is still stuck in a downtrend.
But this is not fresh, impulsive downside anymore. Daily RSI has sunk into the low 30s, MACD is deeply negative but starting to curl, and the price is hovering around the daily pivot after a broad market pullback with Bitcoin dominance up at ~56% and the overall crypto market in Extreme Fear. The dominant force right now is defensive positioning: capital hiding in BTC and stablecoins, while ETH behaves like a risk asset in a risk-off environment. The key question for traders is whether this is the last leg of a medium-term downtrend or the early staging area for a larger base.
Daily Chart (D1) – Macro Bias: Bearish
Trend Structure: EMAs
Values
Price: $1,969.99
EMA 20: $2,201.06
EMA 50: $2,558.76
EMA 200: $3,055.96
What it means
ETH is trading well below its 20, 50, and 200-day EMAs. The shorter EMAs are stacked under the longer one, and the gap between price and the EMA cluster is wide. This is a textbook downtrend regime, with the 20-day acting as the first major dynamic resistance. Any bounce towards $2,200–$2,250 is, by default, a rally into resistance, not a confirmed trend reversal.
Momentum: RSI (14)
Value
RSI 14 (D1): 33.89
What it means
RSI is sitting in a bearish but not fully oversold zone. Sellers are clearly in control, but the market is not in full capitulation territory yet. This is the kind of reading where:
- The downside trend is intact.
- Each new low has slightly less momentum behind it.
- Bounces can appear abruptly if shorts get crowded.
Put simply, the path of least resistance is still down, but the risk of a sharp counter-trend spike is rising.
Momentum & Trend Quality: MACD
Values
MACD line: -224.56
Signal line: -242.03
Histogram: +17.47
What it means
MACD is deeply negative, confirming prolonged bearish momentum. However, the line is now crossing up toward the signal, with the histogram turning positive. That is the first sign that the selling wave is losing strength, even though the trend is still down.
In trading terms, the bear trend is mature. Traders do not chase shorts blindly here; new shorts need either a clear breakdown or a weak bounce into resistance.
Volatility & Range: Bollinger Bands
Values
Mid (basis): $2,156.75
Upper band: $2,654.58
Lower band: $1,658.93
Price: $1,969.99
What it means
Price is sitting below the midline, in the lower half of the band structure, but not hugging the lower band. This points to a down-biased range rather than a full volatility squeeze or panic selloff. Sellers have the upper hand, but they are not pressing ETH to extremes on a daily basis.
As long as ETH stays trapped under the mid-band (around $2,150–2,200), rallies are suspect and more likely to be mean reversion toward resistance than a clean trend reversal.
Volatility & Risk: ATR (14)
Value
ATR 14 (D1): $154.67
What it means
Daily volatility is elevated but not explosive. A typical daily move of about $150 on a $1,970 asset is substantial, but not capitulation-level. This is the kind of tape where swings are meaningful and risk needs to be sized carefully. Entries can be right directionally but still get shaken out by normal noise.
Short-Term Reference Levels: Daily Pivot
Values
Pivot Point: $1,980.09
First Resistance (R1): $1,998.48
First Support (S1): $1,951.61
What it means
ETH is trading just below the daily pivot, in a narrow band between S1 and the pivot. That is classic indecision territory after a selloff: bears have the structural edge, but intraday pricing is balanced enough that either a push back to R1 or a slip toward S1 can happen quickly.
For intraday traders, losing S1 with momentum would confirm that the daily downtrend is reasserting itself. Regaining and holding above the pivot opens the door for a squeeze toward $2,000–2,050, still within a bearish context.
1-Hour Chart (H1) – Short-Term Still Heavy, But Not Collapsing
Trend Structure: EMAs
Values
Price: $1,970.04
EMA 20: $1,981.02
EMA 50: $1,990.59
EMA 200: $2,015.26
What it means
On the 1-hour chart, ETH is trading under all key EMAs, but the gap between price and the 20 and 50 EMAs is relatively small. The regime is still bent downward, yet the market is closer to a short-term equilibrium than to a waterfall.
In practice, this means rallies back into $1,985–2,000 are still sell zones for short-term traders unless price can reclaim and hold above the 200 EMA near $2,015.
Momentum: RSI (14)
Value
RSI 14 (H1): 44.03
What it means
Hourly RSI is in a neutral to mildly bearish area. Selling pressure has cooled off from any extreme. There is room in both directions intraday. ETH can easily push up toward the hourly EMAs before the next decision point, or roll over from here without any signal of exhaustion.
Momentum & Trend Quality: MACD
Values
MACD line: -3.45
Signal line: -1.76
Histogram: -1.69
What it means
On H1, MACD is slightly negative with a negative histogram, so bearish momentum persists but it is not aggressive. This supports the idea of a grinding, corrective tape rather than a fresh impulse down. Short sellers are in control, but they are not steamrolling the market right now.
Volatility & Range: Bollinger Bands
Values
Mid (basis): $1,983.67
Upper band: $2,004.67
Lower band: $1,962.67
What it means
Price is trading just under the mid-band, in the lower half of a fairly tight hourly range. That is consistent with short-term consolidation inside a downtrend. Breaks outside this band, particularly a close below around $1,960 or above about $2,005, would likely bring a pickup in momentum in that direction.
Volatility & Risk: ATR (14)
Value
ATR 14 (H1): $16
What it means
Typical hourly swings of about $16 show that intraday volatility is manageable but non-trivial. Traders cannot rely on ultra-tight stops unless they are willing to be shaken out by routine fluctuations.
Short-Term Reference Levels: Hourly Pivot
Values
Pivot Point: $1,968.94
First Resistance (R1): $1,973.60
First Support (S1): $1,965.38
What it means
ETH is trading almost exactly on top of the hourly pivot. That signals a very short-term balance after prior weakness. Control is up for grabs intraday. A move and hold above R1 favors a push into the $1,980–1,990 resistance belt, while a drop below S1 puts the $1,955–1,950 area in play.
15-Minute Chart (M15) – Execution Context Only
Trend Structure: EMAs
Values
Price: $1,970.04
EMA 20: $1,974.49
EMA 50: $1,979.88
EMA 200: $1,994.79
What it means
On M15, ETH is just below the fast EMAs, which are in turn below the 200 EMA. The microstructure is still bearish, but very close to short-term mean levels. For execution, that means:
- A rejection from the 15-minute 20 and 50 EMAs (around $1,975–1,980) aligns with the broader downtrend and favors short entries.
- A clean reclaim of the 200 EMA (near $1,995) would be the first sign of a more serious intraday squeeze.
Momentum: RSI (14)
Value
RSI 14 (M15): 41.87
What it means
Lower-timeframe RSI is modestly bearish, with plenty of room to move either way. It confirms that short-term selling is present but not extreme, which is a good setup for tactical trades inside the larger trend.
Momentum & Trend Quality: MACD
Values
MACD line: -4.30
Signal line: -4.14
Histogram: -0.16
What it means
M15 MACD is negative but nearly flat. Micro momentum is fading, which often precedes either a minor relief bounce or a volatility contraction before the next move. It does not give a strong directional edge on its own; context from the higher timeframes matters more.
Volatility & Range: Bollinger Bands
Values
Mid (basis): $1,975.31
Upper band: $1,988.04
Lower band: $1,962.58
What it means
ETH is sitting slightly below the mid-band on a reasonably tight 15-minute range. That is classic short-term consolidation. Breaks above $1,985 or below $1,963 on this timeframe will likely set the tone for the next few hours but will not, on their own, change the bigger daily picture.
Volatility & Risk: ATR (14)
Value
ATR 14 (M15): $6.33
What it means
Average 15-minute candles are moving about $6–7. That is enough to punish overleveraged, ultra-tight trades, especially around intraday pivots and EMAs.
Short-Term Reference Levels: 15-Minute Pivot
Values
Pivot Point: $1,970.51
First Resistance (R1): $1,971.14
First Support (S1): $1,969.41
What it means
Price is effectively glued to the 15-minute pivot, with R1 and S1 less than $2 away. This is micro-congestion, the kind of noise band where breakout attempts can quickly fake out. For entries, it is usually better to wait for a move away from this tight cluster.
Market & Sentiment Backdrop
Bitcoin dominance up at ~56.4%, total crypto market cap down about 0.8% in 24 hours, and a Fear & Greed Index at 10 (Extreme Fear) tell the same story: capital is defensive, and altcoins like ETH are not being favored. ETF flows into BTC and ETH have cooled, and volumes are down roughly 12% across the market. This environment tends to cap aggressive upside attempts in ETH unless there is a clear shift back into risk-on behavior.
Main Scenario Based on D1: Bearish Bias With Late-Stage Downtrend Dynamics
Putting it all together, the primary scenario is bearish on the daily timeframe:
- Price is far below the 20, 50, and 200 EMAs.
- RSI is weak but not in full capitulation.
- MACD is deeply negative yet starting to improve.
- Price trades in the lower half of the Bollinger Bands, with moderate but not extreme volatility.
- Market-wide sentiment is deeply fearful and skewed toward BTC dominance.
This combination typically characterizes a mature downtrend. Sellers still have the structural advantage, but the risk of countertrend rallies is non-trivial, especially if shorts become overconfident or macro news improves.
Scenarios
Bullish Scenario – Short Squeeze & Mean Reversion
For the bullish path, think in terms of mean reversion inside a bearish regime, not an instant full reversal.
What bulls need to do
- Defend the $1,950–1,930 zone (around D1 S1 and just above the lower Bollinger Band trajectory). Holding this area signals that sellers are running out of fuel on each dip.
- Reclaim and hold above the daily pivot at around $1,980, then push through $2,000–2,020, where H1 resistance and the 1-hour 200 EMA sit.
- Trigger a follow-through move toward the daily mid-Bollinger and EMA20 zone, roughly $2,150–2,250. That is the key mean-reversion target.
Indicator backdrop supporting a bullish bounce
- Daily RSI in the low 30s with room to move higher if selling pauses.
- Daily MACD histogram turning positive, hinting at fading downside momentum.
- Price oscillating around intraday pivots instead of collapsing through them.
What would invalidate the bullish scenario
- A decisive daily close below around $1,930–1,900 with expanding ATR and RSI breaking toward the 20s. That would indicate fresh selling rather than exhaustion.
- Failure of any bounce to even test the EMA20 on D1, with repeated rejections below around $2,050, would signal that buyers have no real strength.
Bearish Scenario – Trend Resumption & New Lows
The base case, given the D1 regime, is still that rallies are selling opportunities until proven otherwise.
What bears want to see
- Failure to reclaim the EMA20 on D1. As long as ETH remains pinned under roughly $2,200, the broader downtrend is intact.
- Intraday bounces stalling near $1,985–2,020, where the 1-hour EMAs and hourly R1 zones cluster, followed by renewed selling.
- A clean breakdown below $1,950 (D1 S1), opening the door toward the lower Bollinger Band region near $1,700–1,680 if volatility expands.
Indicator backdrop for a bearish continuation
- Daily EMAs remaining steeply downward sloped with price failing to close above the 20-day.
- RSI staying below 40 and rolling lower on each failed bounce.
- MACD failing to complete a bullish cross and instead turning back down, with the histogram flipping negative again.
- ATR starting to rise further as breakdowns occur, indicating stronger directional conviction.
What would invalidate the bearish scenario
- A decisive daily close above the EMA20 (roughly $2,200+) with follow-through buying the next day.
- RSI reclaiming and holding above 50, signaling a regime change from persistent weakness to balanced or bullish momentum.
- MACD crossing bullish on D1 with a sustained positive histogram while price holds above prior resistance levels.
Positioning, Risk, and Uncertainty
This is not a fresh, clean short entry environment, nor is it a high-confidence bottom. It is a late-stage downtrend under macro pressure, with signs of seller fatigue but no confirmed reversal yet:
- Directional bias: bearish on D1, mildly bearish on H1, and choppy on M15.
- Upside moves are currently more likely to be countertrend rallies rather than the start of a new bull leg.
- Downside breaks can still be sharp, especially in an Extreme Fear market that is heavily BTC-centric.
In this kind of environment, traders typically focus less on calling the exact bottom and more on respecting levels and volatility:
- Daily EMAs, especially the 20-day around about $2,200, define whether ETH is just bouncing in a bear trend or transitioning toward a recovery.
- Pivots and ATR on H1 and M15 define how much intraday noise a position has to endure.
- Market-wide fear and BTC dominance tell you that Ethereum crypto is still playing second fiddle to Bitcoin in the current risk-off regime.
As long as ETHUSDT remains below its daily EMA20 and caught in the lower half of its Bollinger Bands, the burden of proof is firmly on the bulls. Any shift out of this structure, with convincing volume and a clear reclaim of key moving averages, would mark a new phase in the tape and warrant a reassessment of the bias.
You May Also Like

Zuckerberg denies Instagram was built to hook children

China Blocks Nvidia’s RTX Pro 6000D as Local Chips Rise