The post Ethereum Reclaims $2,000 as Bitcoin Breaks Above $68K—What’s Next for BTC and ETH Prices? appeared first on Coinpedia Fintech News In recent weeks, theThe post Ethereum Reclaims $2,000 as Bitcoin Breaks Above $68K—What’s Next for BTC and ETH Prices? appeared first on Coinpedia Fintech News In recent weeks, the

Ethereum Reclaims $2,000 as Bitcoin Breaks Above $68K—What’s Next for BTC and ETH Prices?

2026/02/18 17:51
3 min read
For feedback or concerns regarding this content, please contact us at crypto.news@mexc.com
Harvard Dumps Bitcoin for Ethereum

The post Ethereum Reclaims $2,000 as Bitcoin Breaks Above $68K—What’s Next for BTC and ETH Prices? appeared first on Coinpedia Fintech News

In recent weeks, the crypto market has reportedly been consolidating or experiencing a small recovery during Asian trading hours, which is then liquidated with the start of the US trading session. Currently, the top two tokens, Bitcoin and Ethereum, surged beyond their respective resistance at $68,000 and $2,000. While the rally remains stuck within a consolidation, a deeper correction or a strong breakout may only prevent the bears from restricting the prices from securing the threshold at $70,000 for BTC & $2,500 for ETH. 

Bitcoin Price Analysis for Today: Will Bulls Validate the Current Rebound?

Following a strong recovery from the lows below $60,000, the top crypto seems to have gone into a hibernating mode. The BTC price is maintaining a horizontal consolidation, trading within a pre-determined resistance and support at $71,321 and $65,522 for more than a week. At the same time, the volume has been consistently plunging, hinting towards a lowered participation of the traders. In such conditions, it would be interesting to watch how long the BTC price will sustain above $68,000. 

bitcoin price

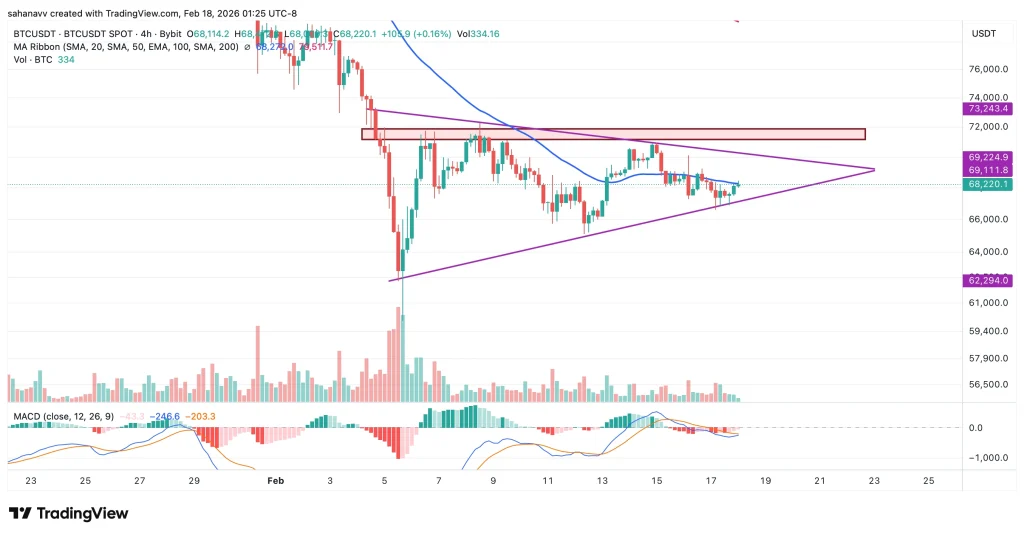
The short-term price action indicates the price is stuck within a decisive symmetrical triangle and triggered a rebound from the support. Despite this rebound, the 50-day MA continues to act as an immediate resistance, while the MACD shows a drop in the selling pressure. Considering the chart patterns, it appears that the BTC price may remain consolidated below $68,000 and may hit an intraday low around $67,300. These upswings and pullbacks may continue until the price reaches the apex of the triangle, which may further initiate a strong price action. 

Ethereum Price Analysis for Today: Can ETH Hold Above $2000?

Ethereum price has been failing to rise above the $2,150 resistance since its breakdown in the first few days of the month. Therefore, these levels have now become a local threshold to break, which may even attract a substantial buying volume. For now, the rise above $2000 appears to be short-lived, as the buying pressure has remained within an average range. 

ethereum price

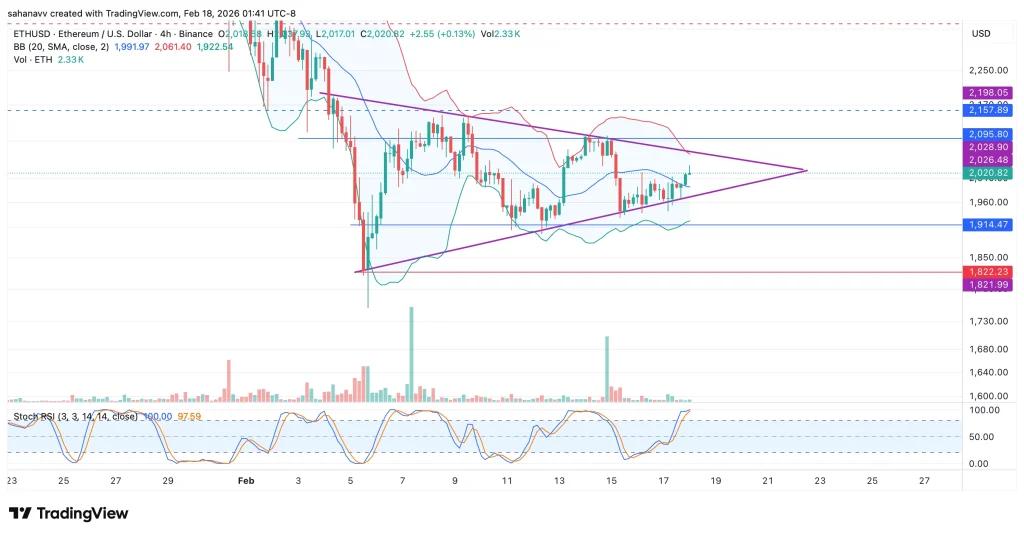
The ETH price is closely following the BTC price rally, as the second-largest token is also stuck within a decisive symmetrical triangle. The volatility is shrinking as the Bollinger bands have begun to squeeze in the short term. On the other hand, the stochastic RSI has entered the upper threshold, and the levels are heading for a bearish crossover that may push the prices lower. The chart patterns suggest the consolidation may continue, and the ETH price may close the day’s trade below $2000 but above the local support at $1914. 

Market Opportunity
Bitcoin Logo
Bitcoin Price(BTC)
$71,496.79
$71,496.79$71,496.79
+5.57%
USD
Bitcoin (BTC) Live Price Chart
Disclaimer: The articles reposted on this site are sourced from public platforms and are provided for informational purposes only. They do not necessarily reflect the views of MEXC. All rights remain with the original authors. If you believe any content infringes on third-party rights, please contact crypto.news@mexc.com for removal. MEXC makes no guarantees regarding the accuracy, completeness, or timeliness of the content and is not responsible for any actions taken based on the information provided. The content does not constitute financial, legal, or other professional advice, nor should it be considered a recommendation or endorsement by MEXC.

You May Also Like

Crucial US Stock Market Update: What Wednesday’s Mixed Close Reveals

Crucial US Stock Market Update: What Wednesday’s Mixed Close Reveals

BitcoinWorld Crucial US Stock Market Update: What Wednesday’s Mixed Close Reveals The financial world often keeps us on our toes, and Wednesday was no exception. Investors watched closely as the US stock market concluded the day with a mixed performance across its major indexes. This snapshot offers a crucial glimpse into current investor sentiment and economic undercurrents, prompting many to ask: what exactly happened? Understanding the Latest US Stock Market Movements On Wednesday, the closing bell brought a varied picture for the US stock market. While some indexes celebrated gains, others registered slight declines, creating a truly mixed bag for investors. The Dow Jones Industrial Average showed resilience, climbing by a notable 0.57%. This positive movement suggests strength in some of the larger, more established companies. Conversely, the S&P 500, a broader benchmark often seen as a barometer for the overall market, experienced a modest dip of 0.1%. The technology-heavy Nasdaq Composite also saw a slight retreat, sliding by 0.33%. This particular index often reflects investor sentiment towards growth stocks and the tech sector. These divergent outcomes highlight the complex dynamics currently at play within the American economy. It’s not simply a matter of “up” or “down” for the entire US stock market; rather, it’s a nuanced landscape where different sectors and company types are responding to unique pressures and opportunities. Why Did the US Stock Market See Mixed Results? When the US stock market delivers a mixed performance, it often points to a tug-of-war between various economic factors. Several elements could have contributed to Wednesday’s varied closings. For instance, positive corporate earnings reports from certain industries might have bolstered the Dow. At the same time, concerns over inflation, interest rate policies by the Federal Reserve, or even global economic uncertainties could have pressured growth stocks, affecting the S&P 500 and Nasdaq. Key considerations often include: Economic Data: Recent reports on employment, manufacturing, or consumer spending can sway market sentiment. Corporate Announcements: Strong or weak earnings forecasts from influential companies can significantly impact their respective sectors. Interest Rate Expectations: The prospect of higher or lower interest rates directly influences borrowing costs for businesses and consumer spending, affecting future profitability. Geopolitical Events: Global tensions or trade policies can introduce uncertainty, causing investors to become more cautious. Understanding these underlying drivers is crucial for anyone trying to make sense of daily market fluctuations in the US stock market. Navigating Volatility in the US Stock Market A mixed close, while not a dramatic downturn, serves as a reminder that market volatility is a constant companion for investors. For those involved in the US stock market, particularly individuals managing their portfolios, these days underscore the importance of a well-thought-out strategy. It’s important not to react impulsively to daily movements. Instead, consider these actionable insights: Diversification: Spreading investments across different sectors and asset classes can help mitigate risk when one area underperforms. Long-Term Perspective: Focusing on long-term financial goals rather than short-term gains can help weather daily market swings. Stay Informed: Keeping abreast of economic news and company fundamentals provides context for market behavior. Consult Experts: Financial advisors can offer personalized guidance based on individual risk tolerance and objectives. Even small movements in major indexes can signal shifts that require attention, guiding future investment decisions within the dynamic US stock market. What’s Next for the US Stock Market? Looking ahead, investors will be keenly watching for further economic indicators and corporate announcements to gauge the direction of the US stock market. Upcoming inflation data, statements from the Federal Reserve, and quarterly earnings reports will likely provide more clarity. The interplay of these factors will continue to shape investor confidence and, consequently, the performance of the Dow, S&P 500, and Nasdaq. Remaining informed and adaptive will be key to understanding the market’s trajectory. Conclusion: Wednesday’s mixed close in the US stock market highlights the intricate balance of forces influencing financial markets. While the Dow showed strength, the S&P 500 and Nasdaq experienced slight declines, reflecting a nuanced economic landscape. This reminds us that understanding the ‘why’ behind these movements is as important as the movements themselves. As always, a thoughtful, informed approach remains the best strategy for navigating the complexities of the market. Frequently Asked Questions (FAQs) Q1: What does a “mixed close” mean for the US stock market? A1: A mixed close indicates that while some major stock indexes advanced, others declined. It suggests that different sectors or types of companies within the US stock market are experiencing varying influences, rather than a uniform market movement. Q2: Which major indexes were affected on Wednesday? A2: On Wednesday, the Dow Jones Industrial Average gained 0.57%, while the S&P 500 edged down 0.1%, and the Nasdaq Composite slid 0.33%, illustrating the mixed performance across the US stock market. Q3: What factors contribute to a mixed stock market performance? A3: Mixed performances in the US stock market can be influenced by various factors, including specific corporate earnings, economic data releases, shifts in interest rate expectations, and broader geopolitical events that affect different market segments uniquely. Q4: How should investors react to mixed market signals? A4: Investors are generally advised to maintain a long-term perspective, diversify their portfolios, stay informed about economic news, and avoid impulsive decisions. Consulting a financial advisor can also provide personalized guidance for navigating the US stock market. Q5: What indicators should investors watch for future US stock market trends? A5: Key indicators to watch include upcoming inflation reports, statements from the Federal Reserve regarding monetary policy, and quarterly corporate earnings reports. These will offer insights into the future direction of the US stock market. Did you find this analysis of the US stock market helpful? Share this article with your network on social media to help others understand the nuances of current financial trends! To learn more about the latest stock market trends, explore our article on key developments shaping the US stock market‘s future performance. This post Crucial US Stock Market Update: What Wednesday’s Mixed Close Reveals first appeared on BitcoinWorld.
Share
Coinstats2025/09/18 05:30
TRX Price Prediction: Testing $0.32-$0.35 Resistance Zone as Technical Momentum Builds

TRX Price Prediction: Testing $0.32-$0.35 Resistance Zone as Technical Momentum Builds

TRON (TRX) consolidates at $0.28 with neutral RSI signals. Technical analysis suggests potential breakout toward $0.32-$0.35 resistance zone amid mixed momentum
Share
BlockChain News2026/03/04 15:57
Pi Network DEX Launch Confirmed for March 12, 2026: A New Chapter for Picoin and Web3 Trading

Pi Network DEX Launch Confirmed for March 12, 2026: A New Chapter for Picoin and Web3 Trading

    Pi Network has officially confirmed the launch date of its decentralized exchange (DEX), scheduled for Marc
Share
Hokanews2026/03/04 15:52