

An analyst has identified a recurring pattern of expansion after a period of consolidation on the Shiba Inu chart, suggesting it might see a repeat. History does not repeat itself, but it often rhymes; this principle might apply to Shiba Inu, an analyst has insinuated. Specifically, Kamran Asghar highlighted a recurring pattern of price accumulation and parabolic expansion on the meme coin’s weekly chart, suggesting that things will align as they have in the past. Consolidation Phase Nearing End? For context, this pattern has seen the price of Shiba Inu consolidate within a rectangular range for months, then explode after sustaining a breakout. The rhythm has occurred twice since 2021, and the commentator projects that Shiba Inu will follow that trend this time. An accompanying chart highlights the specific periods during which this happened. It shows that SHIB entered an accumulation phase in May 2021, when it dropped to $0.00000630, and remained within this range until a breakout in late September 2021. Shiba Inu Analysis/Kamran Asghar SHIB soared 1,154% to its all-time high of $0.000088554 in five weeks, illustrating how quickly its value can escalate when it gains momentum. Meanwhile, after the high, Shiba Inu retraced massively to enter another consolidation phase, starting from May 2022. The accumulation spanned a much longer period this time, lasting until February 2024. Then, Shiba Inu surged to a high of $0.00004563 in March 2024, with Asghar's chart indicating that this resulted in 501% increase. Shiba Inu Could Reach New ATH After Breakout Meanwhile, Shiba Inu entered another accumulation phase in late January, following its dip to $0.00001471, and has since trended within the range. However, Asghar suggested that the phase could be winding down. If it breaks out and history rhymes, then Shiba Inu could go parabolic from here. The analyst stated that the meme coin appears poised for a massive expansion, targeting greater heights. Moreover, his chart highlights that the rally could take the prominent meme coin to a new all-time high. He marked the target around $0.0000900, representing an approximately 619% upsurge from the current market price of $0.0000251 and an unprecedented level for Shiba Inu. Notably, an earlier The Crypto Basic report aligns with this $0.000090 target. The analysis utilized Changelly to project when Shiba Inu could reach the target, and according to the report, this could occur in late 2028.An analyst has identified a recurring pattern of expansion after a period of consolidation on the Shiba Inu chart, suggesting it might see a repeat. History does not repeat itself, but it often rhymes; this principle might apply to Shiba Inu, an analyst has insinuated. Specifically, Kamran Asghar highlighted a recurring pattern of price accumulation and parabolic expansion on the meme coin’s weekly chart, suggesting that things will align as they have in the past. Consolidation Phase Nearing End? For context, this pattern has seen the price of Shiba Inu consolidate within a rectangular range for months, then explode after sustaining a breakout. The rhythm has occurred twice since 2021, and the commentator projects that Shiba Inu will follow that trend this time. An accompanying chart highlights the specific periods during which this happened. It shows that SHIB entered an accumulation phase in May 2021, when it dropped to $0.00000630, and remained within this range until a breakout in late September 2021. Shiba Inu Analysis/Kamran Asghar SHIB soared 1,154% to its all-time high of $0.000088554 in five weeks, illustrating how quickly its value can escalate when it gains momentum. Meanwhile, after the high, Shiba Inu retraced massively to enter another consolidation phase, starting from May 2022. The accumulation spanned a much longer period this time, lasting until February 2024. Then, Shiba Inu surged to a high of $0.00004563 in March 2024, with Asghar's chart indicating that this resulted in 501% increase. Shiba Inu Could Reach New ATH After Breakout Meanwhile, Shiba Inu entered another accumulation phase in late January, following its dip to $0.00001471, and has since trended within the range. However, Asghar suggested that the phase could be winding down. If it breaks out and history rhymes, then Shiba Inu could go parabolic from here. The analyst stated that the meme coin appears poised for a massive expansion, targeting greater heights. Moreover, his chart highlights that the rally could take the prominent meme coin to a new all-time high. He marked the target around $0.0000900, representing an approximately 619% upsurge from the current market price of $0.0000251 and an unprecedented level for Shiba Inu. Notably, an earlier The Crypto Basic report aligns with this $0.000090 target. The analysis utilized Changelly to project when Shiba Inu could reach the target, and according to the report, this could occur in late 2028.
Massive Shiba Inu Expansion to New ATH Imminent as Consolidation Nears End
For feedback or concerns regarding this content, please contact us at crypto.news@mexc.com
An analyst has identified a recurring pattern of expansion after a period of consolidation on the Shiba Inu chart, suggesting it might see a repeat. History does not repeat itself, but it often rhymes; this principle might apply to Shiba Inu, an analyst has insinuated. Specifically, Kamran Asghar highlighted a recurring pattern of price accumulation and parabolic expansion on the meme coin’s weekly chart, suggesting that things will align as they have in the past. Consolidation Phase Nearing End? For context, this pattern has seen the price of Shiba Inu consolidate within a rectangular range for months, then explode after sustaining a breakout. The rhythm has occurred twice since 2021, and the commentator projects that Shiba Inu will follow that trend this time. An accompanying chart highlights the specific periods during which this happened. It shows that SHIB entered an accumulation phase in May 2021, when it dropped to $0.00000630, and remained within this range until a breakout in late September 2021. 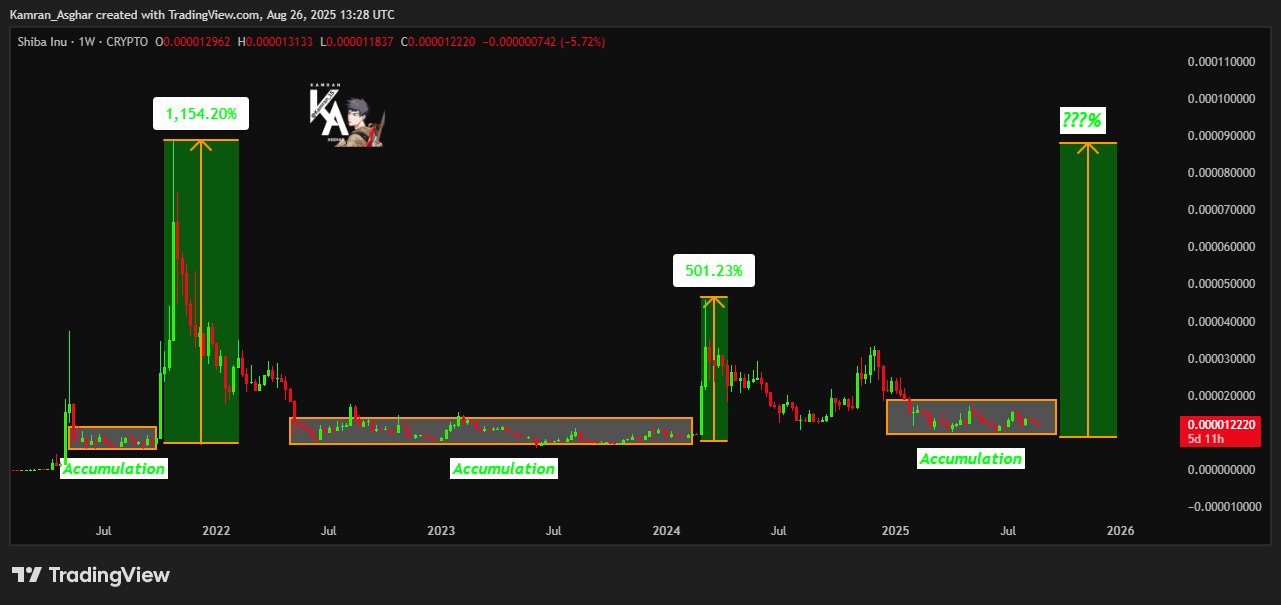 Shiba Inu Analysis/Kamran Asghar SHIB soared 1,154% to its all-time high of $0.000088554 in five weeks, illustrating how quickly its value can escalate when it gains momentum. Meanwhile, after the high, Shiba Inu retraced massively to enter another consolidation phase, starting from May 2022. The accumulation spanned a much longer period this time, lasting until February 2024. Then, Shiba Inu surged to a high of $0.00004563 in March 2024, with Asghar's chart indicating that this resulted in 501% increase. Shiba Inu Could Reach New ATH After Breakout Meanwhile, Shiba Inu entered another accumulation phase in late January, following its dip to $0.00001471, and has since trended within the range. However, Asghar suggested that the phase could be winding down. If it breaks out and history rhymes, then Shiba Inu could go parabolic from here. The analyst stated that the meme coin appears poised for a massive expansion, targeting greater heights. Moreover, his chart highlights that the rally could take the prominent meme coin to a new all-time high. He marked the target around $0.0000900, representing an approximately 619% upsurge from the current market price of $0.0000251 and an unprecedented level for Shiba Inu. Notably, an earlier The Crypto Basic report aligns with this $0.000090 target. The analysis utilized Changelly to project when Shiba Inu could reach the target, and according to the report, this could occur in late 2028.
Shiba Inu Analysis/Kamran Asghar SHIB soared 1,154% to its all-time high of $0.000088554 in five weeks, illustrating how quickly its value can escalate when it gains momentum. Meanwhile, after the high, Shiba Inu retraced massively to enter another consolidation phase, starting from May 2022. The accumulation spanned a much longer period this time, lasting until February 2024. Then, Shiba Inu surged to a high of $0.00004563 in March 2024, with Asghar's chart indicating that this resulted in 501% increase. Shiba Inu Could Reach New ATH After Breakout Meanwhile, Shiba Inu entered another accumulation phase in late January, following its dip to $0.00001471, and has since trended within the range. However, Asghar suggested that the phase could be winding down. If it breaks out and history rhymes, then Shiba Inu could go parabolic from here. The analyst stated that the meme coin appears poised for a massive expansion, targeting greater heights. Moreover, his chart highlights that the rally could take the prominent meme coin to a new all-time high. He marked the target around $0.0000900, representing an approximately 619% upsurge from the current market price of $0.0000251 and an unprecedented level for Shiba Inu. Notably, an earlier The Crypto Basic report aligns with this $0.000090 target. The analysis utilized Changelly to project when Shiba Inu could reach the target, and according to the report, this could occur in late 2028.Market Opportunity
SHIBAINU Price(SHIB)
$0.000006348
$0.000006348$0.000006348
USD
SHIBAINU (SHIB) Live Price Chart


Disclaimer: The articles reposted on this site are sourced from public platforms and are provided for informational purposes only. They do not necessarily reflect the views of MEXC. All rights remain with the original authors. If you believe any content infringes on third-party rights, please contact crypto.news@mexc.com for removal. MEXC makes no guarantees regarding the accuracy, completeness, or timeliness of the content and is not responsible for any actions taken based on the information provided. The content does not constitute financial, legal, or other professional advice, nor should it be considered a recommendation or endorsement by MEXC.
You May Also Like

African Tech Investment London: ATS 2026 at LSE
African tech investment London peaks at Africa Tech Summit 2026 — 350+ delegates, 50+ speakers, LSE, 29 May. The post African Tech Investment London: ATS 2026 at
Share
Furtherafrica2026/05/15 09:00

Best Crypto Presales to Watch While Iran Slams “Collusion”
Middle East tension is feeding back into crypto markets as Iran criticizes U.S.-Israel actions, and reports around Netanyahu’s secret UAE visit add another layer
Share
Brave New Coin2026/05/15 09:43
Red state immigration law stopped cold by GOP-appointee days before it was to take effect
A Texas law that would allow state and local police to arrest people suspected of having crossed the southern border illegally is once again halted, a day before
Share
Rawstory2026/05/15 09:03


