BNB Hits Historic Undervaluation Zone: Here’s What’s Next
- BNB is trading 37% below its short-term holder realized price, a level that has historically triggered sharp recoveries for the asset.
- The RSI sits at 35.62 near oversold territory while the MACD histogram is shrinking, signaling a possible exhaustion of the current downtrend.
- Analysts say the $587 weekly support is the line to watch, with a double bottom potentially setting up a retest of the $800 price range.
BNB has hit a previously unseen level of valuation according to analysts, propelling price discovery in the entire cryptocurrency market.
After having declined 89% from its October 2025 high of almost $1,400, BNB trades between $628-$629 as of writing, or approximately 55% below its cycle high.
Data, technical readings and the structural indicators are all pointing to this level of valuation, which in the past has preceded significant recoveries in BNB.
On-Chain Data Confirms BNB Is Trading at a Deep Discount
On-chain analyst OnChainMind reported that BNB is currently sitting about 37% below its short-term holder realized price equivalent. This gap has historically acted as a reliable marker of meaningful undervaluation for the asset.
Past cycles have shown that BNB tends to reprice sharply when it reaches this level.
The case for undervaluation is not based on a single metric. Analysts are pointing to a combination of compressed valuation ratios, declining NVT metrics, and visible long-term holder accumulation patterns.
Overall, these findings hint that the market has discounted BNB from its current price to reflect its actual utility in terms of use on the Binance network. Binance’s long-term structural demand for BNB will continue coming from fee discounts, periodic BNB token burns, and other Binance investments.
That demand has not weakened even as price corrected sharply. When utility holds firm while price falls, valuation compression typically follows.
What the Charts Are Saying Right Now
The daily chart tells a story of a severe correction now approaching a potential turning point.
BNB bottomed near the $550–$580 zone in early February 2026, recovering modestly to its current price of around $628. However, the broader structure still favors bears until a confirmed reversal is established.
The MACD reading shows the extent of the damage. The MACD line sits at 7.77 while the signal line sits at -51.20, producing a historically wide bearish histogram of -58.97.
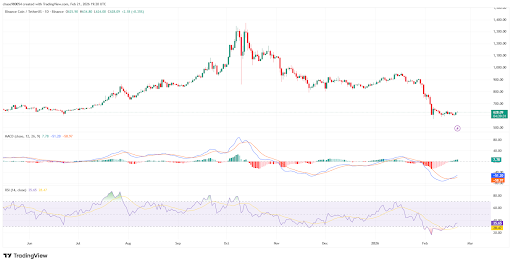 BNB Hits Historic Undervaluation Zone : Source TradingView
That said, the histogram bars are beginning to shrink, which analysts read as a possible sign of downside exhaustion. The RSI at 35.62 is approaching oversold territory, with its moving average resting at 28.47.
That moving average reading suggests the February low was struck under extreme bearish conditions. A technical mean-reversion move toward the $700–$750 resistance range is now a realistic near-term scenario being tracked by traders.
The $587 Support Level Now Defines What Comes Next
Analyst ZachHumphries identified $587 as the critical horizontal support on the weekly chart.
A successful defense of this level could produce a double bottom formation, which would set up a potential retest of the $800 range and beyond. The weekly candle close carries particular weight in confirming or denying this scenario.
Losing $587, however, changes the picture entirely. The analyst flagged a thin air pocket below that level, with limited structure before the $496 zone. That would represent a meaningful additional drop from current prices.
Traders on both sides of the trade are watching the weekly close before committing to a directional position.
Two Paths Forward as BNB Approaches a Decision Point
The bull case for BNB centers on the $587 support holding and buyers building momentum from the undervaluation zone.
A recovery toward $700–$750 in the near term would be the first meaningful test of whether the bounce has legs. Breaking that resistance would then shift focus to the $800 target.The bear case remains equally valid.
A failure at current levels without a strong weekly close above $587 would leave BNB vulnerable to a deeper correction.
The air pocket below support is thin, and a breakdown could move quickly. Traders are keeping position sizing cautious until the weekly structure becomes clearer.
The post BNB Hits Historic Undervaluation Zone: Here’s What’s Next appeared first on Live Bitcoin News.


You May Also Like

Zip US and InComm Payments Bring Flexible Payments to Gift Cards, Giving Shoppers a New Way to Pay

Retech Machinery to Exhibit at INTERPLAS 2026 in Birmingham, UK