

Bitcoin Price Pullback: How Whales and Retail Investors Are Reacting
Bitcoin’s price movements since early October can safely be categorized as bearish, given the fact that the asset shed over 50% of its value from its all-time high to its multi-year low of $60,000 marked on February 6.
Although it has recovered some ground since then, the cryptocurrency is deep in the red even on a year-to-date scale. Santiment investigated which investor group sold off during the months-long correction, and which increased their positions.
Who’s Selling and Buying?
The post from the analytics company reveals an interesting pattern. It reads that wallets holding between 10 and 10,000 bitcoins have reduced their positions by 0.8% since the October peak. In contrast, micro investors, those with 0.1 BTC or less, have increased their holdings by 2.5% within the same timeframe.
The analysis reads that this behavior from both groups does not suggest an upcoming price reversal.
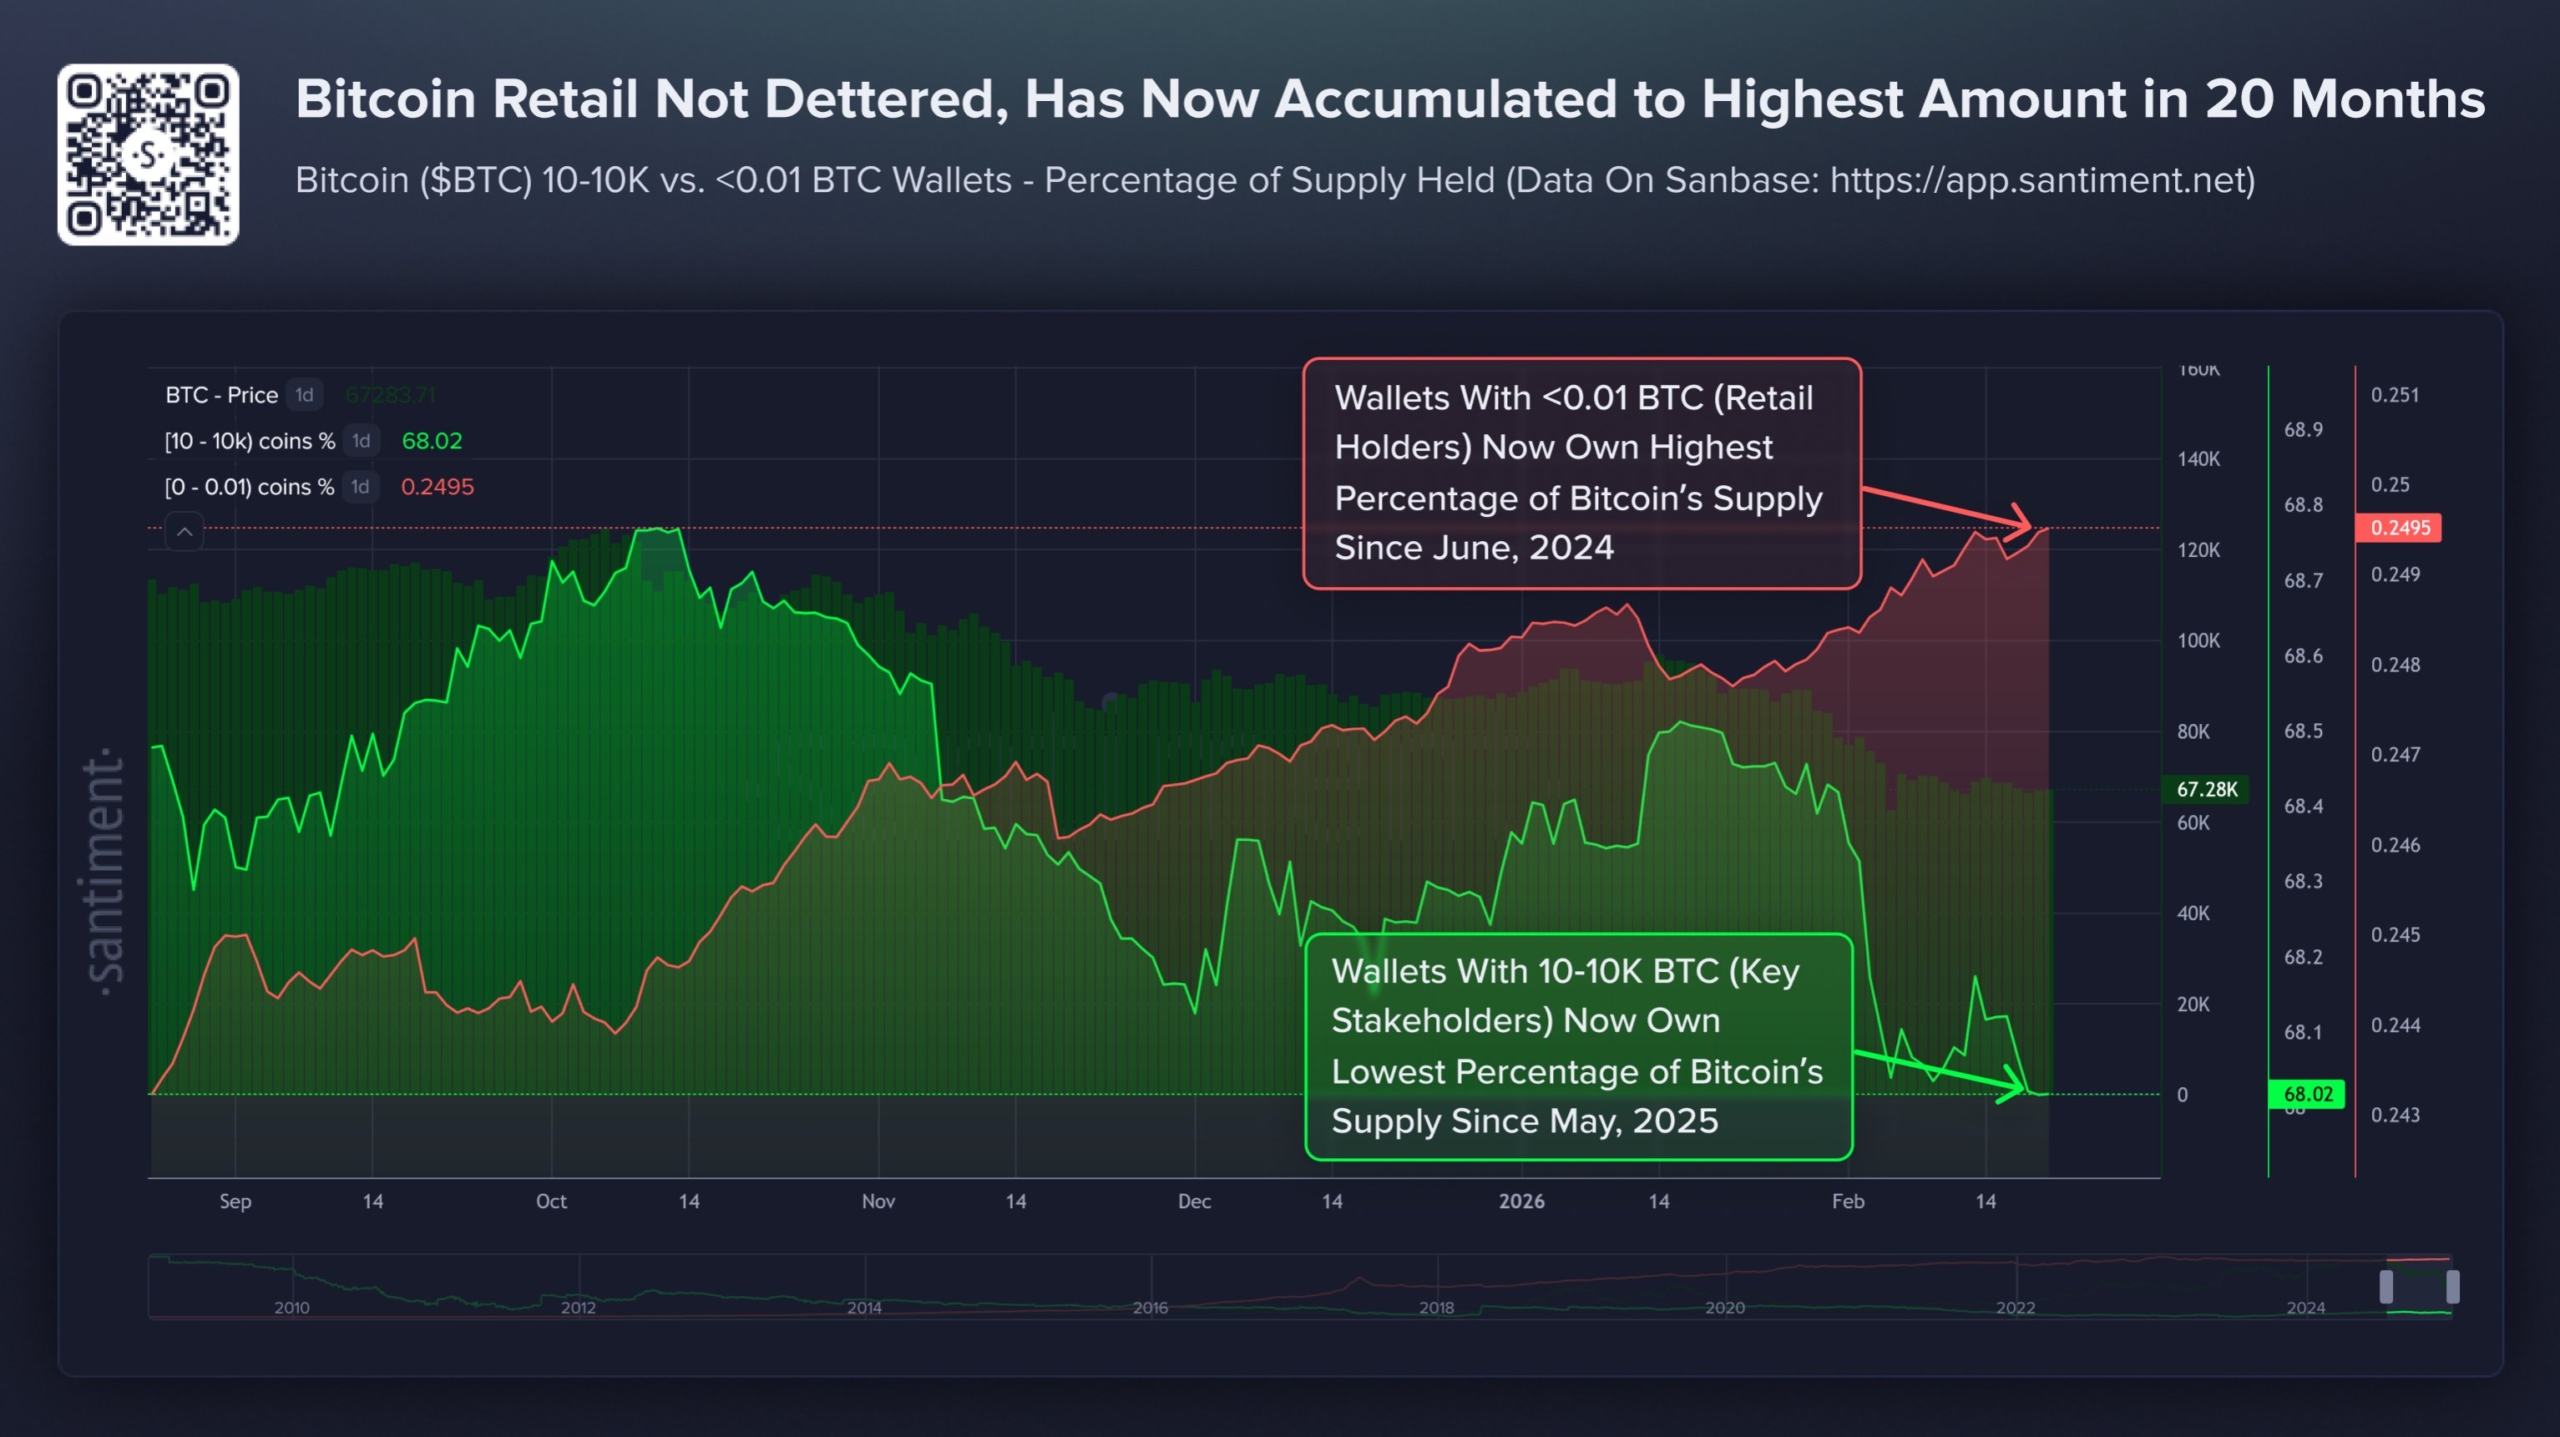 Bitcoin Investor Behavior. Source: Santiment
ETF Investors Flock
Unlike the small discrepancy between the two investor groups examined by Santiment, those who gain exposure to the largest cryptocurrency through ETFs have shown a clear and painful trend. In the two weeks leading to the asset’s all-time high of over $126,000, they poured in over $6 billion into the funds.
Since then, red has dominated almost every week, with multiple $1 billion or more net outflow examples. In three consecutive weeks in early November, they withdrew more than $3.5 billion. This behavior continued into the new year, and the spot Bitcoin ETFs are currently on a massive red streak of five weeks in a row in the red.
Data from SoSoValue shows that these investors pulled out $1.33 billion during the week that ended on January 23. Another $1.49 billion followed, but the silver lining is that the net inflows have decreased to under $360 million in the past three weeks. Nevertheless, the total net inflows into the spot BTC ETFs have declined from $62.77 billion in early October to $54 billion last Friday.
 Spot Bitcoin ETFs Net Flows. Source: SoSoValue
The post Bitcoin Price Pullback: How Whales and Retail Investors Are Reacting appeared first on CryptoPotato.


You May Also Like

Iran’s foreign minister targeted in assassination attempt, wife killed

Galaxy Digital Files First Nasdaq Annual Report, Targets $15 Billion AI Data Center Expansion – Crypto News Bitcoin News


