

Bitcoin price under pressure as extreme fear grips the crypto market

Market conditions remain fragile as the Bitcoin price grinds lower in an environment of risk-off sentiment, extreme fear, and only tentative signs of stabilization.
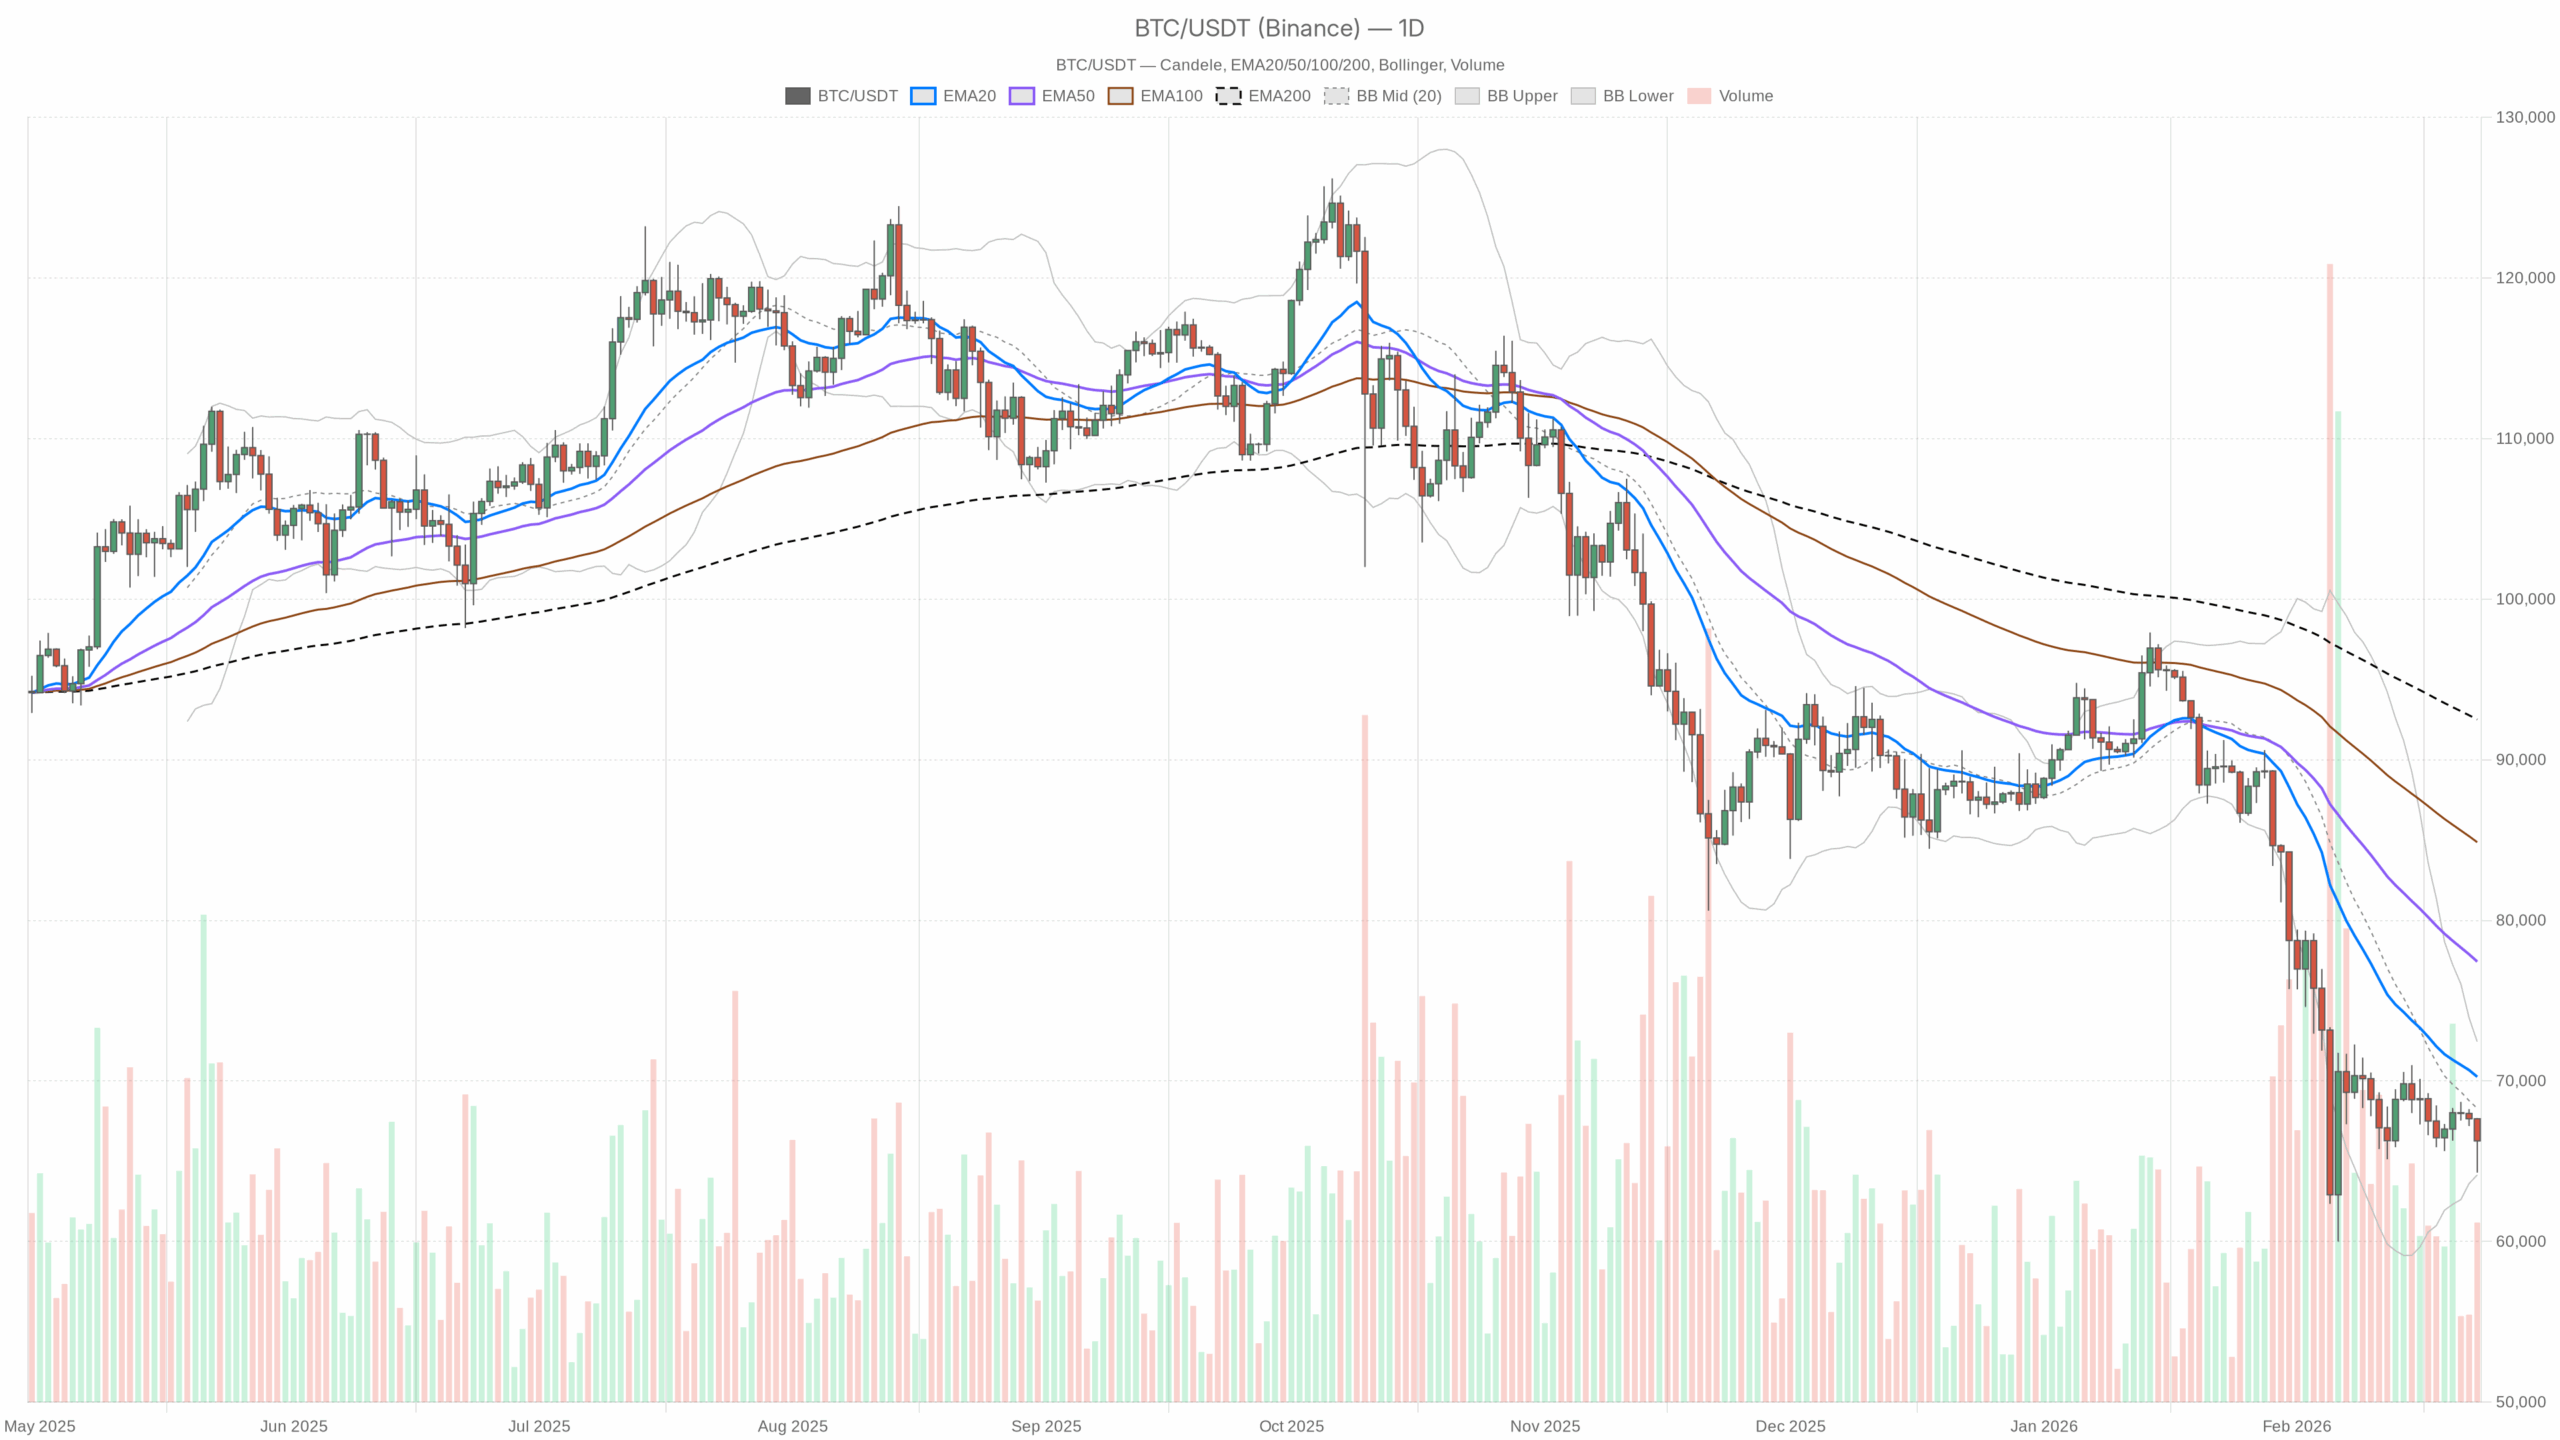 BTC/USDT — daily chart with candlesticks, EMA20/EMA50 and volume.
Daily Structure (D1): Macro Bias is Bearish
The main scenario on the daily timeframe is bearish. Trend, positioning, and sentiment are aligned to the downside, even if a relief bounce is increasingly likely.
Trend & EMAs (EMA20 / EMA50 / EMA200)
Bitcoin‘s daily close is $66,264, well below all key EMAs:
- EMA20: $70,256
- EMA50: $77,429
- EMA200: $92,505
Price trading under the 20, 50, and 200-day EMAs with clear separation confirms a dominant downtrend. The short-term moving average (20 EMA) is accelerating away from price, which shows persistent selling pressure and a lack of aggressive dip-buying. Until BTC can reclaim at least the 20-day EMA on a closing basis, rallies are mechanically rallies within a downtrend, not a trend change.
RSI (Daily)
Daily RSI14 sits at 34.1.
Momentum is weak, but not yet classically oversold. That means sellers are still in control, but the downside energy is starting to get stretched. From here, another sharp leg lower would likely drive RSI into the 20s, where forced liquidations and panic often coexist with strong countertrend bounces. In other words, conditions are bearish but close to a zone where short-covering rallies can be violent.
MACD (Daily)
Daily MACD line: -3720, signal: -4321, histogram: +601.
MACD being deeply negative confirms we are in a mature downswing, but the positive histogram (MACD line crossing up toward the signal) hints that the downside momentum is starting to slow. This often precedes consolidation or a relief rally rather than a fresh immediate collapse. The trend is still down, but the speed of the downtrend is moderating.
Bollinger Bands (Daily)
Bollinger mid-band: $68,294, upper: $72,442, lower: $64,147. Price is at $66,264, hovering in the lower half of the band but not pinned to the lower band.
Price pulling back from the lower band and drifting just above it shows the aggressive selling spike is easing into more of a grind. The lower band near $64k is the first volatility-based support. Repeated tests of that area without strong rejection would increase the risk of a band walk lower, but a sharp bounce off that band would signal short-term exhaustion among sellers.
ATR (Daily)
ATR14 on the daily is around $2,527.
That implies an average daily range of roughly 3.8% at current levels, elevated but not capitulation-level chaos. Volatility is high enough to punish tight stops and late chasers in either direction. From a structural standpoint, this is typical of the middle phase of a correction: volatility is elevated, but not yet at the blow-off extremes that often mark cycle lows.
Daily Pivot Levels
Daily pivot levels:
- Pivot point (PP): $66,080
- Resistance 1 (R1): $67,869
- Support 1 (S1): $64,475
Bitcoin is trading essentially on top of the daily pivot, indicating an intraday tug-of-war right at a key equilibrium level. A sustained move above R1 (~$67.9k) would signal that buyers are willing to chase beyond simple mean reversion. A break and hold below S1 (~$64.5k) would open the door to another momentum leg lower, with the Bollinger lower band at ~$64.1k acting as a first downside magnet.
Hourly Structure (H1): Bearish Bias, but Selling Is Losing Urgency
On the 1-hour chart, Bitcoin price is around $66,294 with the regime still marked as bearish, but the micro-structure is no longer one-way selling.
Trend & EMAs (1H)
On H1:
- Price: $66,294
- EMA20: $66,333
- EMA50: $67,036
- EMA200: $67,639
Price is essentially sitting on the 20 EMA, still below the 50 and 200 EMAs. This says the short-term slide has paused; we have moved from impulsive selling to more of a sideways-to-slightly-down drift. Until price can reclaim and hold above the 50 and especially the 200-hour EMA, any strength is best read as a bounce within a broader downtrend, not a fresh uptrend.
RSI (1H)
Hourly RSI14 is around 46.7.
Momentum on the hourly has reset back toward neutral. Sellers are no longer pressing as aggressively, but buyers have not seized control either. It is a wait-and-see zone where the next impulse, macro headline or liquidations, will likely decide direction.
MACD (1H)
Hourly MACD line: -578, signal: -588, histogram: +10.
MACD is still negative but trying to cross up. This is exactly what a short-covering or mean-reversion phase looks like on the way out of a selloff: the bears are no longer gaining ground, but they have not been forced to capitulate yet. The next strong impulse move from here will tell us if this was just a pause before more downside, or the start of a more meaningful bounce.
Bollinger Bands & ATR (1H)
On H1, the Bollinger mid-band is $66,489 with upper at $68,813 and lower at $64,165. Price is marginally below the mid-band.
That placement reflects mild intraday pressure but no panic. Hourly ATR14 of about $597 confirms sizable but manageable intraday swings, enough to whipsaw very tight entries, but not the sort of extreme volatility that forces systemic de-leveraging by itself.
Hourly Pivot Levels
On the 1-hour pivot set:
- PP: $66,101
- R1: $66,529
- S1: $65,866
Price hovering just above the hourly pivot shows short-term balance. A clean move above R1 would align with the slight MACD improvement and could fuel a push toward the hourly 50 EMA around $67k. A drop back under S1 would reassert intraday selling pressure and turn this into another stair-step lower inside the daily downtrend.
15-Minute Context: Short-Term Bounce Inside a Bigger Downtrend
The 15-minute chart is where the first signs of a bounce are visible, but they are firmly intraday in nature.
Trend & EMAs (15m)
On M15:
- Price: $66,288
- EMA20: $65,743
- EMA50: $65,969
- EMA200: $67,074
Price trading above the 20 and 50 EMAs but still well below the 200 EMA shows a short-term bullish reaction inside a broader bearish environment. Short-covering and opportunistic buyers are pushing price higher intraday, but the larger trend filter (200 EMA) is still overhead and acting as dynamic resistance.
RSI (15m)
RSI14 on 15m is at 65.1.
This shows short-term momentum has swung decisively to the upside, edging toward overbought on the very short timeframe. Late chasers on M15 are vulnerable if the move stalls. From a bigger picture standpoint, it looks more like a local relief pop than the start of a sustained bull leg.
MACD (15m)
15-minute MACD line: +119, signal: +14, histogram: +106.
Here, MACD has flipped firmly positive with a strong histogram. That lines up with the EMAs and RSI to describe an active intraday bounce. The risk is that this move runs into the 15m 200 EMA or nearby higher-timeframe resistance and fades, which would trap late long entries.
Bollinger Bands & ATR (15m)
M15 Bollinger mid-band: $65,632, upper: $66,370, lower: $64,893. Price at $66,288 is hugging the upper band.
Riding the upper band on 15m is typical for a short-term squeeze or bounce. Combined with ATR14 around $229, intraday swings are meaningful but not unmanageable. For tactical traders, this is a spot to tighten risk, as the asymmetry for a pure momentum long is starting to deteriorate on this timeframe.
15-Minute Pivot Levels
M15 pivots:
- PP: $66,297
- R1: $66,317
- S1: $66,268
Price is basically sitting on the pivot, very close to R1. That reflects a short-term equilibrium after a quick push higher. A clear break above R1 with strong volume would extend the squeeze. A rejection here would support the idea that this is just a corrective pop inside the daily downtrend.
Market Context: Extreme Fear, Heavy Selling, but Rising Volume
Bitcoin dominance is around 56.4%, with total crypto market cap at roughly $2.35T, down about 2.36% over 24 hours. Volume is up sharply (around +72% 24h), which tells you this is not a quiet drift lower. Instead, this is active repricing in a risk-off environment.
The fear and greed index at 5 (Extreme Fear) confirms sentiment is deeply negative. Historically, such extremes often correspond to late stages of a down move or the early phase of basing, but they do not time the exact low. Extreme fear can persist while price continues to leak lower, especially if macro headlines, like tariffs and regulatory uncertainty, keep hitting the tape.
Scenarios for Bitcoin Price
Primary Bias: Bearish on the Daily
The daily regime and trend keep the main scenario bearish. Shorter timeframes are showing attempts at stabilization and bounce, but they are working against a well-established downswing.
Bullish Scenario
In the bullish pathway, the current extreme fear and oversold-leaning momentum fuel a multi-day relief rally:
- Bitcoin holds above the daily S1 region (~$64.5k) and ideally above the Bollinger lower band (~$64.1k).
- Hourly structure turns from bearish to constructive: price clears the H1 50 EMA (~$67k) and then the 200 EMA (~$67.6k) with MACD crossing decisively positive.
- On the daily chart, BTC reclaims the pivot (~$66.1k) and pushes toward the Bollinger mid-band and EMA20, with a first meaningful target zone around $68.5k–$70.5k.
If that plays out, the move would likely be framed as an oversold bounce within a broader downtrend unless and until the 20-day EMA is reclaimed and held. A true trend shift would require daily closes back above the 20 EMA and a clear improvement in MACD and RSI toward neutral or slightly bullish territory.
Bullish scenario invalidation: A daily close below the $64k region (S1 and Bollinger lower band) with RSI sliding firmly into the 20s and rising ATR would indicate a fresh momentum leg down, not a base. That would undermine the relief-rally thesis and put lower levels in play.
Bearish Scenario
In the bearish continuation case, the current intraday bounce is just short-covering before the next selloff:
- 15m and 1h momentum (RSI and MACD) roll over from current elevated levels without breaking the H1 200 EMA.
- Price fails to sustain above $67k–$68k and is repeatedly capped below the hourly and daily mid-Bollinger levels.
- Daily RSI pushes from the mid-30s toward the 20s as BTC breaks below S1 ($64.5k) and the lower band (~$64.1k), extending the downtrend.
In that setup, the market likely sees another air pocket lower with expanding ATR. Forced liquidations, macro headlines, and continued risk-off flows could drive a sharp extension down, with traders watching prior structural support zones below current data.
Bearish scenario invalidation: A clean reclaim of the H1 200 EMA followed by a daily close back above the 20-day EMA (~$70.3k) would seriously weaken the bearish continuation case. If that happens with MACD turning positive on the daily and RSI recovering toward 50, the narrative would shift from selling rallies to buying dips again.
How to Think About Positioning Right Now
The market is in a classic tension: the structure is still bearish on the daily, but sentiment is washed out and short-term momentum is trying to mean-revert. That mix produces violent two-way volatility and traps for both late shorts and impulsive bottom buyers.
For traders, the key is time horizon:
- On the daily, trend-followers are still aligned with the downside as long as price holds below the 20-day EMA. Rally attempts into $68k–$70k are, for now, more likely to be tested as selling opportunities than the start of a new bull leg.
- On the intraday side (1h and 15m), there is room for tactical long and short setups around pivots and EMAs, but they are trading against a higher-timeframe downtrend. That raises the bar for conviction on any intraday long exposure.
Volatility is elevated but not yet climactic, and macro uncertainty is very much alive. This is not a low-risk environment. Position sizing, staggered entries and exits, and respect for key levels ($64k on the downside, $70k on the upside) matter more than usual. The opportunity set is real, as extreme fear often coincides with future upside, but so is the risk of being early or overstaying a view in a market that is still structurally pointed down. For now, the Bitcoin price remains under pressure within a broader corrective phase.


You May Also Like

Ethereum Weakness Traces Back To One Exchange. Analyst Identifies The Cause

Why Choose Sunriseaccountants.net for Professional Payroll Management


