

Aave crypto: bearish structure faces a short-term bounce attempt

Market conditions remain volatile as Aave crypto trades a short-term bounce within a broader bearish structure across major timeframes.
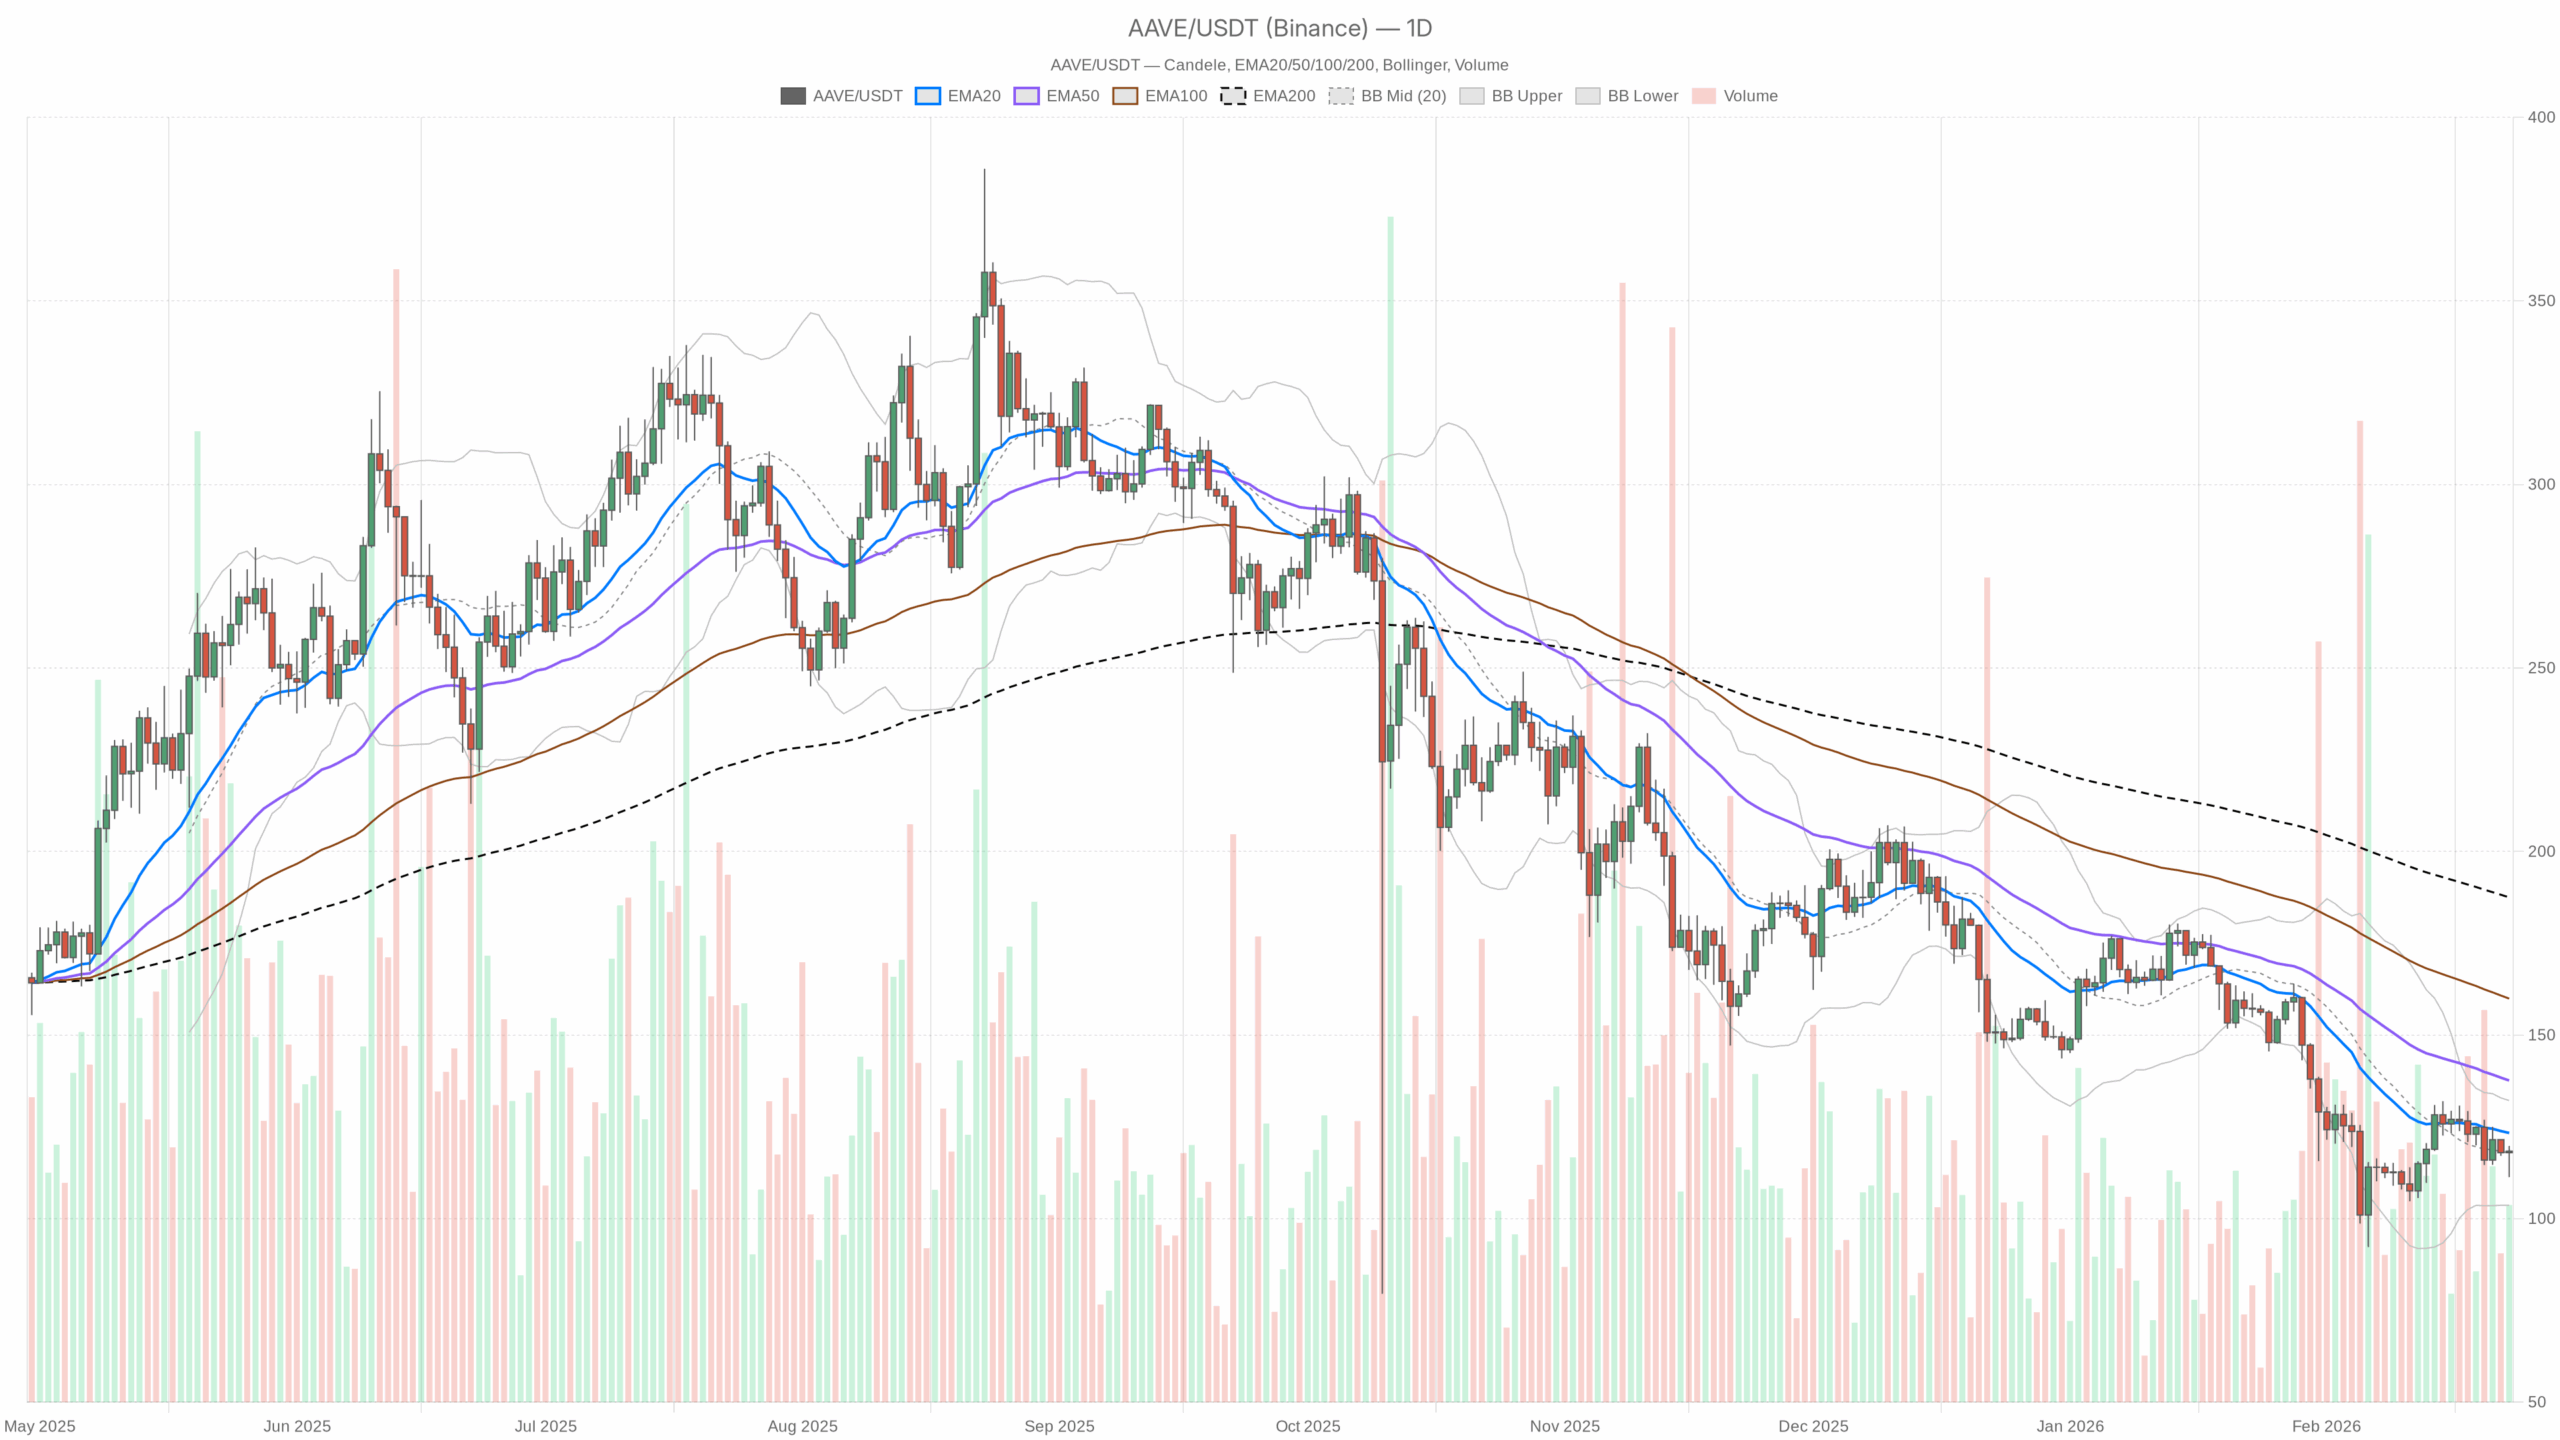 AAVE/USDT — daily chart with candlesticks, EMA20/EMA50 and volume.
Aave crypto now: bounce inside a broader downturn
Aave (AAVEUSDT) is trading around 118.4, trying to stabilize after a sustained downtrend. The daily chart is still clearly bearish, but intraday price action is attempting a modest recovery. In other words, this looks more like a counter-trend bounce than the start of a confirmed trend reversal.
This moment matters because broader crypto is in risk-off mode: total market cap is down about 2% over 24 hours, BTC dominance is high above 56%, and the fear & greed index sits in Extreme Fear (5). In that kind of environment, rallies in DeFi names like Aave crypto are guilty until proven innocent.
The dominant force right now is defensive positioning. The daily structure points down, while the 1H and 15m timeframes show a short-term attempt to mean-revert higher. Moreover, bulls are playing for a squeeze; bears are selling into strength.
Daily timeframe (D1): primary bias is bearish
On the daily chart, Aave crypto remains in a clear downtrend, with price action struggling to reclaim key dynamic resistance levels.
Trend structure & EMAs (D1)
Price vs EMAs:
– Close: 118.37
– EMA 20: 123.32
– EMA 50: 137.61
– EMA 200: 187.51
– Regime: bearish
What it means: Price is below all three major EMAs, and the short EMA (20) is below the 50, which in turn sits far below the 200. That is a classic bearish alignment. The market has been selling rallies rather than buying dips, and the distance to the 200 EMA highlights how deep this downtrend has already gone. Any bounce toward 123–138 is, by default, a potential selling zone until price can reclaim and hold above at least the 20 and 50 EMAs.
RSI (D1)
RSI 14: 42.85
What it means: Momentum is weak but not oversold. Aave crypto has worked off the most aggressive selling pressure but has not yet shifted back to bullish momentum. This is the type of RSI zone where price can drift sideways to slightly higher before sellers reappear, unless a strong catalyst forces a genuine trend change.
MACD (D1)
MACD:
– Line: -5.26
– Signal: -6.78
– Histogram: 1.51 (positive)
What it means: Both MACD line and signal are still below zero, confirming the broader bearish trend. However, the positive histogram says downside momentum is losing steam and the two lines are closing the gap. In practice, this often precedes a corrective rally or at least a pause in the downtrend, not an automatic trend reversal. Bears remain in control, but they are no longer pressing as hard as before.
Bollinger Bands (D1)
Bands:
– Middle band (20-period basis): 117.90
– Upper band: 132.16
– Lower band: 103.65
– Price: 118.37, near the middle band
What it means: Aave crypto has bounced back toward the middle of the range after spending time lower. Trading near the mid-band usually signals mean reversion within a broader move rather than a new leg in either direction. There is roughly 10–15% room to the lower and upper bands, indicating decent volatility, but not a blow-off environment. Until price starts closing above the mid-band and pushing toward the upper band, the primary assumption is “rally within a downtrend.”
ATR & volatility (D1)
ATR 14: 8.56
What it means: Daily volatility is elevated. An average daily swing of about $8–9 on a roughly $118 asset is significant. Position sizes that worked fine in a calmer market may now be too large. From a structural standpoint, this level of ATR fits a liquidation or high-uncertainty phase more than a quiet accumulation phase.
Daily pivot levels (D1)
Pivot points:
– Pivot (PP): 116.49
– First resistance (R1): 121.68
– First support (S1): 113.18
What it means: Price is trading slightly above the daily pivot at 116.49, leaning modestly bullish for today’s session, but still trapped below the first resistance near 121.7. The key battleground on the daily is this 116–122 region. Holding above 116 keeps the short-term bounce alive; losing it reopens the path toward 113 and potentially closer to the lower Bollinger band near 104.
1-hour timeframe (H1): counter-trend bounce taking shape
The 1-hour chart paints a different picture: short-term buyers have stepped in, but they are trading against the larger bearish context and structural downtrend.
Trend structure & EMAs (H1)
Price vs EMAs:
– Close: 118.48
– EMA 20: 116.93
– EMA 50: 117.92
– EMA 200: 120.05
– Regime: neutral
What it means: Price is now above the 20 and 50 EMAs on the 1H, but still below the 200 EMA at 120.05. That is textbook counter-trend action: local momentum has flipped up, but the higher-timeframe trend ceiling, the 200 EMA, is still overhead. Bulls need to reclaim and hold above 120 on a closing basis to turn this from a simple bounce into something more meaningful.
RSI (H1)
RSI 14: 56.37
What it means: Intraday momentum is mildly bullish, with some room to keep pushing higher before hitting any overbought territory. This fits a scenario where price can probe into the 119–121 area, but it does not yet point to an aggressive squeeze. It is firm, not euphoric.
MACD (H1)
MACD:
– Line: 0.02
– Signal: -0.61
– Histogram: 0.63 (positive)
What it means: On the 1H chart, MACD has crossed above its signal line and poked back into positive histogram territory, signaling a fresh intraday upswing. However, the absolute values are still close to zero, so this is early-phase momentum, not a mature trend. For now, it supports the idea of a modest bounce toward the 200 EMA rather than a sustained breakout.
Bollinger Bands (H1)
Bands:
– Middle band: 116.15
– Upper band: 120.82
– Lower band: 111.49
– Price: 118.48, above the mid-band but below the upper band
What it means: Price is trending above the mid-band, showing buyers are in control of the current 1H swing. There is overhead room toward the upper band around 121. However, because the daily structure is still down, moves to the upper band on the 1H are more likely to attract profit-taking or fresh selling than aggressive breakout buying.
ATR & intraday volatility (H1)
ATR 14: 1.79
What it means: Typical 1-hour swings of around $1.8 are not trivial at this price. For intraday traders in Aave crypto, that is enough to run tight stops and still get whipped out if levels are poorly chosen. The market is active, not sleepy, which favors disciplined, level-based execution over chasing candles.
Hourly pivot levels (H1)
Pivot points:
– Pivot (PP): 118.25
– First resistance (R1): 119.14
– First support (S1): 117.58
What it means: Price is hovering just above the hourly pivot and under R1. Intraday, this is a classic inflection zone. Holding above 118.25 keeps pressure on 119–120; slipping back below 118.25 and then 117.6 would show that the bounce is fading and sellers are retaking the short-term initiative.
15-minute timeframe (M15): execution context, not a trend signal
On the 15-minute chart, we are looking at micro-structure, which is useful for timing, but it does not override the daily bias or main trend.
Trend structure & EMAs (M15)
Price vs EMAs:
– Close: 118.43
– EMA 20: 117.91
– EMA 50: 116.88
– EMA 200: 117.87
– Regime: neutral
What it means: Price sits above all key EMAs on M15, reflecting a short-term up-leg within the session. The fact that the EMAs are clustered tightly between roughly 116.9 and 117.9 shows the recent volatility burst has started to compress. This is often a prelude to a new push in either direction. Given the higher-timeframe context, any failure to stay above 117.9–118.0 would quickly shift the micro-structure back in favor of sellers.
RSI (M15)
RSI 14: 58.21
What it means: Short-term momentum is positive but not stretched. There is still room for a marginal push higher before the market needs to cool off. For execution, that means chasing the last few dollars of upside is increasingly risky relative to the reward, especially with the daily trend pointing down.
MACD (M15)
MACD:
– Line: 0.70
– Signal: 0.84
– Histogram: -0.15 (slightly negative)
What it means: Here the picture diverges from the 1H: the MACD line has dipped just below its signal, and the histogram has turned slightly negative. On this micro timeframe, upside momentum is already cooling off. That lines up with a short-term pullback or consolidation after the initial bounce, which intraday traders in Aave crypto will feel as chop around current levels.
Bollinger Bands (M15)
Bands:
– Middle band: 118.17
– Upper band: 119.53
– Lower band: 116.80
– Price: 118.43, slightly above the middle band
What it means: Price is hugging the mid-to-upper half of the band, consistent with a mild uptrend on very short timeframes. However, the lack of strong band expansion and the slight MACD loss of steam warn that the immediate punch higher is slowing. From an execution standpoint, this typically argues for patience rather than chasing breakouts on a 15-minute chart.
ATR & micro-volatility (M15)
ATR 14: 0.80
What it means: Typical 15-minute candles moving around $0.8 show that noise can be substantial relative to tight stops. This is fine for experienced scalpers, but easy to mismanage for anyone relying on static, very tight risk parameters.
15-minute pivot levels (M15)
Pivot points:
– Pivot (PP): 118.36
– First resistance (R1): 118.63
– First support (S1): 118.15
What it means: Price is essentially sitting on the pivot, boxed between nearby support and resistance. This highlights indecision at the micro level. There is no clear advantage to bulls or bears in the next few candles, reinforcing that the more important signals are coming from the 1H and daily charts.
Reconciling the timeframes for Aave crypto
There is clear tension across timeframes that traders must reconcile before taking directional risk.
- Daily (D1): Bearish trend, below all major EMAs, with only early signs of momentum cooling. This defines the main scenario as bearish.
- 1H: Short-term bounce underway, testing resistance levels below the 200 EMA.
- 15m: Micro uptrend already losing some steam, hinting at consolidation or a minor pullback.
The market logic is straightforward: the dominant regime is still down, but Aave crypto is in a corrective upswing. Mean reversion players are trying to ride the bounce; trend followers are watching for where to re-engage on the short side or where the downtrend may finally fail.
Bullish scenario for Aave (counter-trend, for now)
For a credible bullish case, Aave needs to turn this intraday bounce into something more structural and sustained across higher timeframes.
Key steps for bulls:
- Hold above 116–117 on the daily, roughly in line with the D1 pivot (116.49) and recent intraday support. As long as price stays above this area, the bounce remains technically intact.
- Break and hold above 120–122, which clusters the H1 200 EMA (around 120.05) and the D1 R1 (around 121.68). A clean move through this zone, with hourly closes holding above, would show that buyers can absorb supply at a key trend line.
- Push into 130–135, near the daily upper Bollinger band (132.16) and approaching the 20 EMA (123.32) and then the 50 EMA (137.61). If price can start closing days above the 20 EMA and grinding toward the 50 EMA, the narrative shifts from “dead cat bounce” to “potential trend repair.”
Indicator alignment for the bullish case would look like this: daily RSI lifting back above 50, MACD crossing up toward zero, and price spending more time at or above the Bollinger mid-band than below it.
What invalidates the bullish scenario?
A decisive breakdown below 113–114 (under D1 S1 at 113.18) would show that the current bounce failed and sellers have fully regained control. In that case, the path of least resistance reopens toward the lower daily Bollinger band near 104, and intraday bullish structures on 1H and 15m would be considered traps rather than basing patterns.
Bearish scenario for Aave (in line with the main trend)
The bearish scenario is currently the dominant one, given the daily structure and the broader risk-off backdrop in crypto markets in 2024.
Key steps for bears:
- Defend 120–122. If each attempt to break above the H1 200 EMA and daily R1 is rejected, with wicks above and closes back below 120, that confirms this area as a strong supply zone.
- Break back under 116–117, flipping the daily pivot from support into resistance. Intraday, that would show the bounce has run its course.
- Extend the move toward 113, then 105–104, tracking D1 S1 and the lower Bollinger band. With daily ATR at 8.56, those downside targets are reachable in relatively few sessions if selling volume returns.
On the indicator side, bears want to see daily RSI slipping back firmly into the 30s, MACD histogram rolling back over toward negative, and price failing to sustain closes above the daily mid-band. That combination would mark the end of the current pause and the start of a fresh leg down.
What invalidates the bearish scenario?
If Aave crypto can reclaim and hold above 125–130 on daily closes, clearly above the 20 EMA and pressing toward the upper Bollinger band, then the simple “sell every rally” playbook starts to break. A daily trend transition would be in progress, and shorts would lose the structural advantage. In that world, the dominant narrative would shift from trend-following shorts to dip-buying and potential base-building.
Positioning, risk, and how to think about Aave here
This is not a low-risk environment. The entire crypto market is under stress, volatility is up, and sentiment is pinned in extreme fear. Aave crypto is no exception: the daily trend is still pointed down, while shorter timeframes show only a tactical bounce.
For traders, the message from the indicators is consistent:
- The daily structure is bearish. Any long exposure is, by definition, counter-trend until price proves otherwise.
- The 1H and 15m timeframes are suitable for timing entries and exits within that framework, not for rewriting the macro picture.
- Elevated ATR on all timeframes means sizing and stop placement matter more than usual; small errors are amplified.
With this setup, clarity comes from respecting the levels: 113–117 on the downside, 120–122 above, and 125–130 for a real regime shift. Until those zones break convincingly, Aave crypto remains a market where both sides can get chopped up, and only disciplined, level-driven trading stands a chance of surviving the volatility.


You May Also Like
Australian Dollar Dips Below 0.7100 as Middle East Tensions Weigh on Risk Sentiment

Fed Governor Calls For Strong Stablecoin Oversight As CLARITY Act’s Final Text Gets Delayed


