

Data reveals how Bitcoin holders behave after reaching new highs
Author: Glassnode
Compiled by: Felix, PANews
PANews Note: The original article was first published on December 4 ; this article only represents the author ’s views and does not constitute investment advice.
Key points:
- After consolidating between $54,000 and $74,000 for a period of time, Bitcoin hit a new high of $99,400 (PANews Note: it has now broken through $100,000, hitting a new high of $104,000).
- Several risk indicators monitored have entered very high risk territory, reflecting the state of rising unrealized profits and the increased sensitivity of investor sentiment to corrections.
- The realized profit/loss ratio shows that large-scale profit-taking is underway, suggesting that demand may dry up in the near term.
- Realized profit volume has fallen 76% from its historical peak, and perpetual contract funding rates are also falling, indicating that the market is cooling rapidly.
- Early supply redistribution patterns suggest a key demand cluster between $87,000 and $98,000, with little supply changing hands during the rally from $74,000 to $87,000.
Higher range
After the market reached its first major peak in early March, Bitcoin traded between $54,000 and $74,000 for about eight months until early November. The long period of sideways trading in a narrow price range caused much of the circulating supply to be redistributed and concentrated around a relatively high cost base.
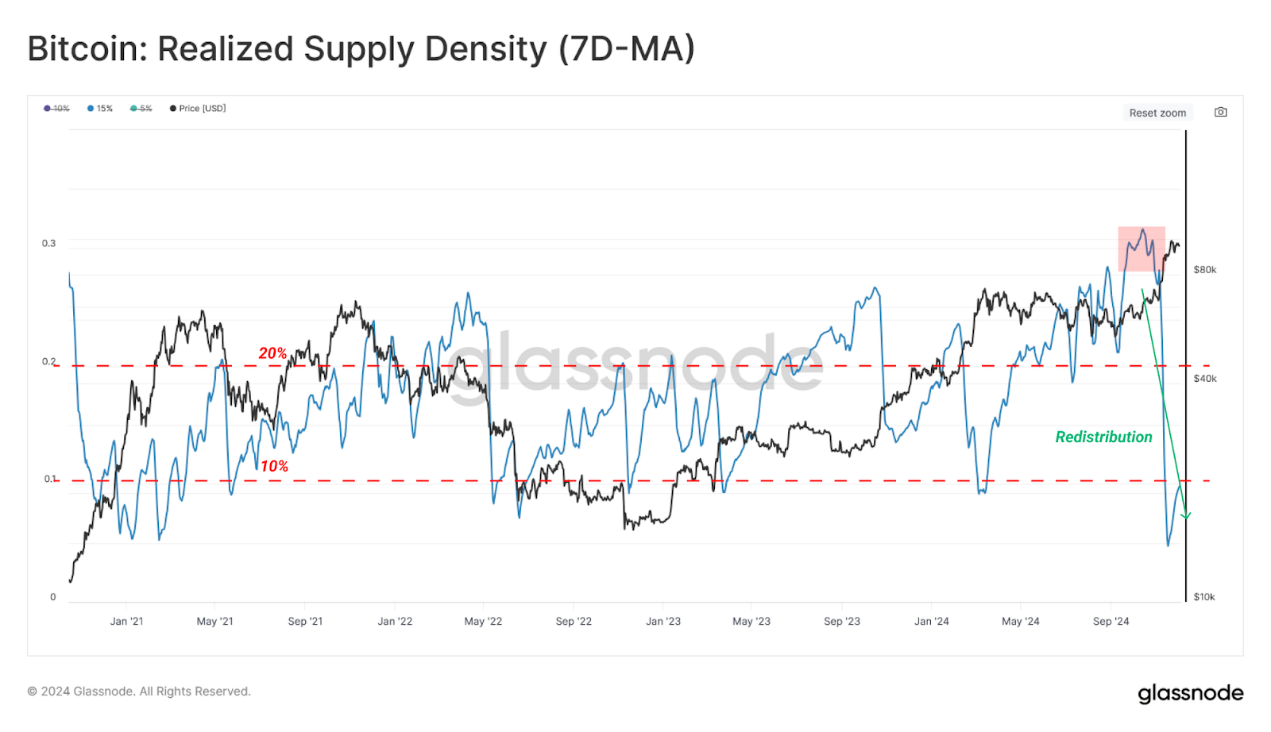
This supply concentration could heighten the likelihood of investor panic when downside volatility re-emerges. To track these dynamics, the Actual Supply Density metric was introduced, a tool that quantifies the supply concentration within a ±15% price volatility range of the current spot price.
High supply concentration suggests that price fluctuations can significantly affect investors' profitability, which in turn may increase market volatility.
Looking back at major market moves over the past five years, a common pattern emerges:
- During periods of market indecision, typically more than 20% of supply is concentrated within ±15% of the mid-price.
- This often results in wild price swings in either direction, resulting in either a profit or a loss for that supply.
This volatility often pushes the realized supply density metric below 10%, indicating that a large number of tokens are now holding significantly different amounts of unrealized profits or losses.
The recent breakout above $74,000 triggered one of these redistribution cycles, driving Bitcoin prices to new highs and pushing the realized supply density metric (±15%) below 10%, in which case many investors received large unrealized profits.
Data source: Glassnode
New high after the interval
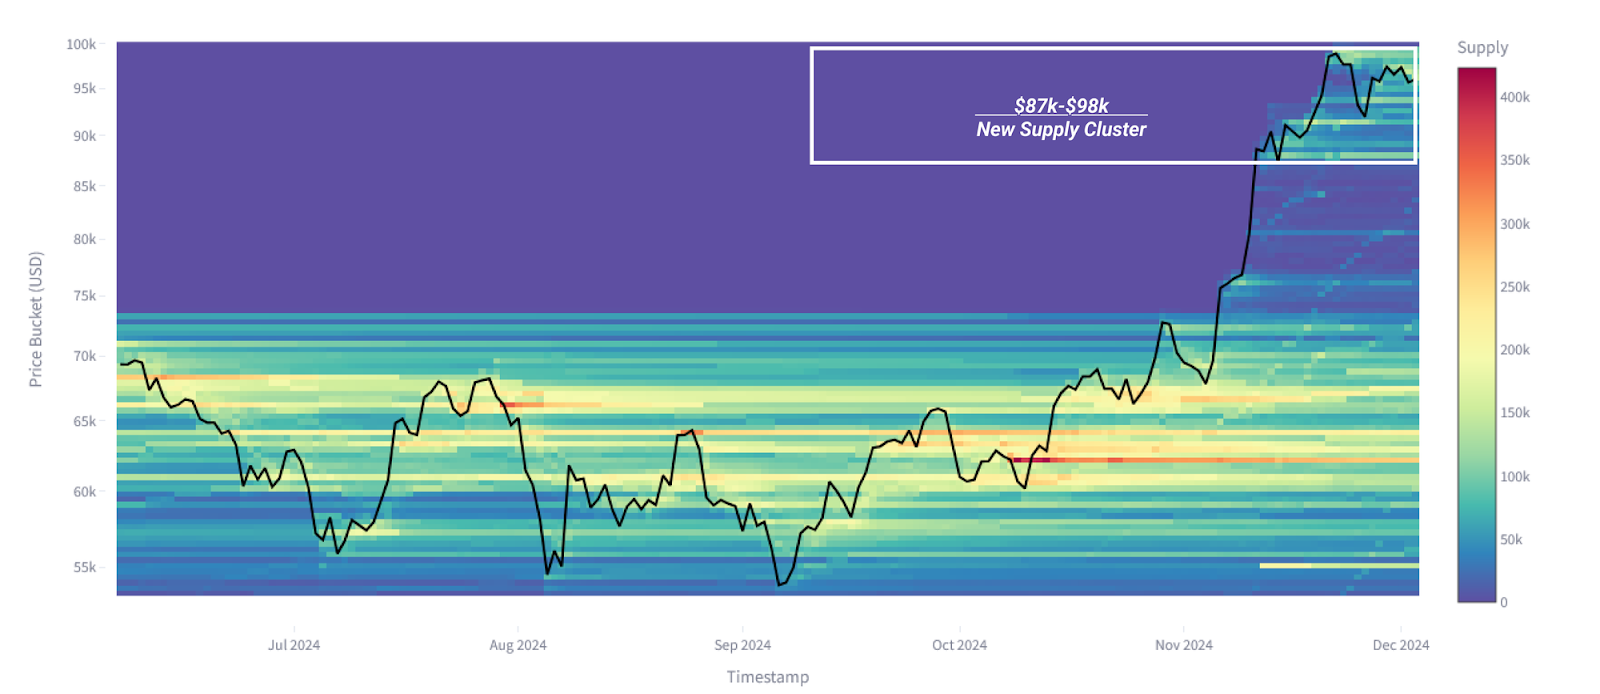
To explore the dynamics of supply changing hands during price discovery, a new concept called Bitcoin Cost Basis Distribution (CBD) can be utilized. This indicator tracks the concentration of supply at different price points through a heat map. The Bitcoin CBD indicator provides insights into how supply is redistributed over time at different price levels, helping to identify key areas of demand and investor interest.
As we enter the early stages of price discovery, the upper and lower range bands have not yet fully formed. The most important supply cluster is hovering between $87,000 and $98,000, with very little changing hands during the rally to $87,000.
This suggests that the current trading range is still searching for a balance between buyers and sellers, but risks remain.
Data source: Glassnode
Assessing market risk
Reference is made below to a set of metrics designed to categorize different risk thresholds using on-chain data.
1. Measuring supply profitability
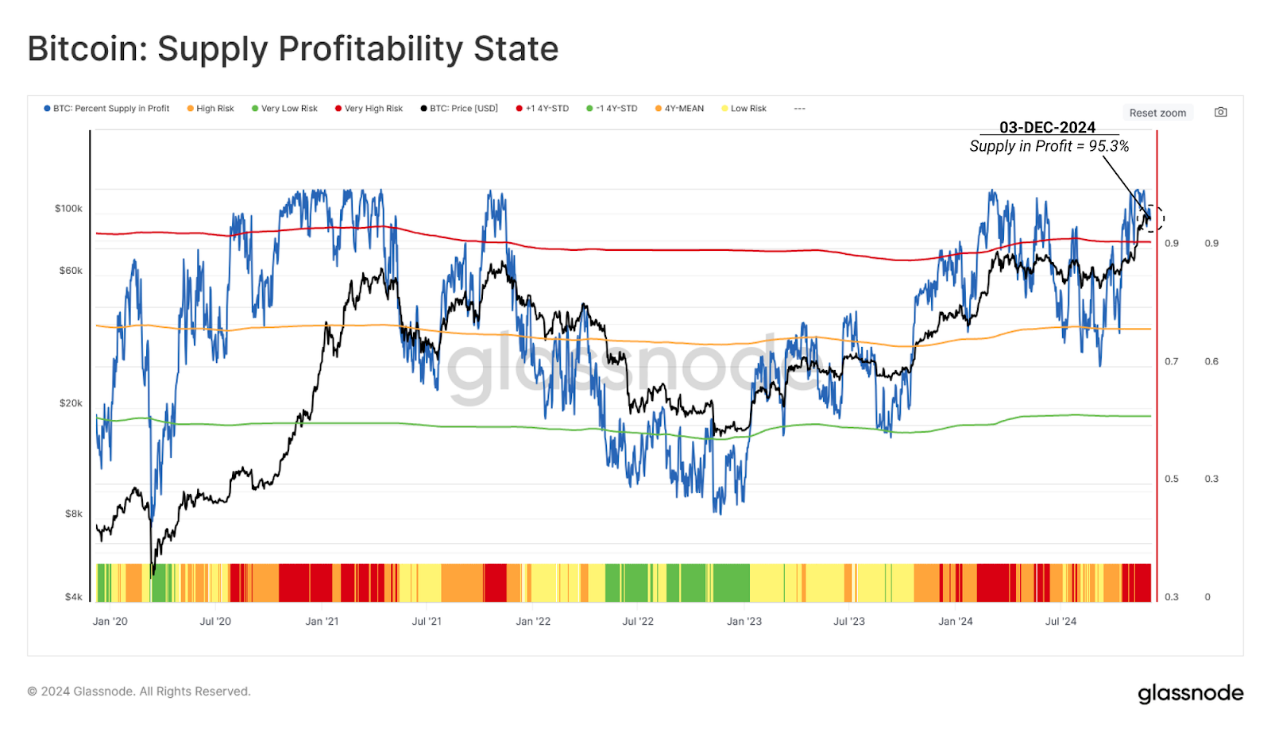
The Profit Supply Percentage (PSIP) indicator uses the proportion of supply holding unrealized profits to describe market cycles. This can provide insight into potential risk of selling pressure, as investors with unrealized profits are often incentivized to lock in gains.
The PSIP indicators are divided into four risk levels:
- Very high risk: PSIP > 90%, more than one standard deviation above its historical average
- High risk: 75% < PSIP < 90%, slightly higher than its historical average
- Low risk: 58% < PSIP < 75%, lower than the average but higher than the lower limit
- Very low risk: PSIP < 58%, more than one standard deviation below its historical average
Periods when the PSIP trades above the upper limit usually coincide with the euphoria phase of a bull market. The recent price breakout has pushed the PSIP indicator into the euphoria phase, and such levels have historically been associated with increased vulnerability to downside corrections as investors have an incentive to realize profits, thereby generating indirect supply.
This suggests that market participants need to be cautious as the likelihood of increased selling pressure also rises accordingly.
Data source: Glassnode
2. Weighing fear and greed
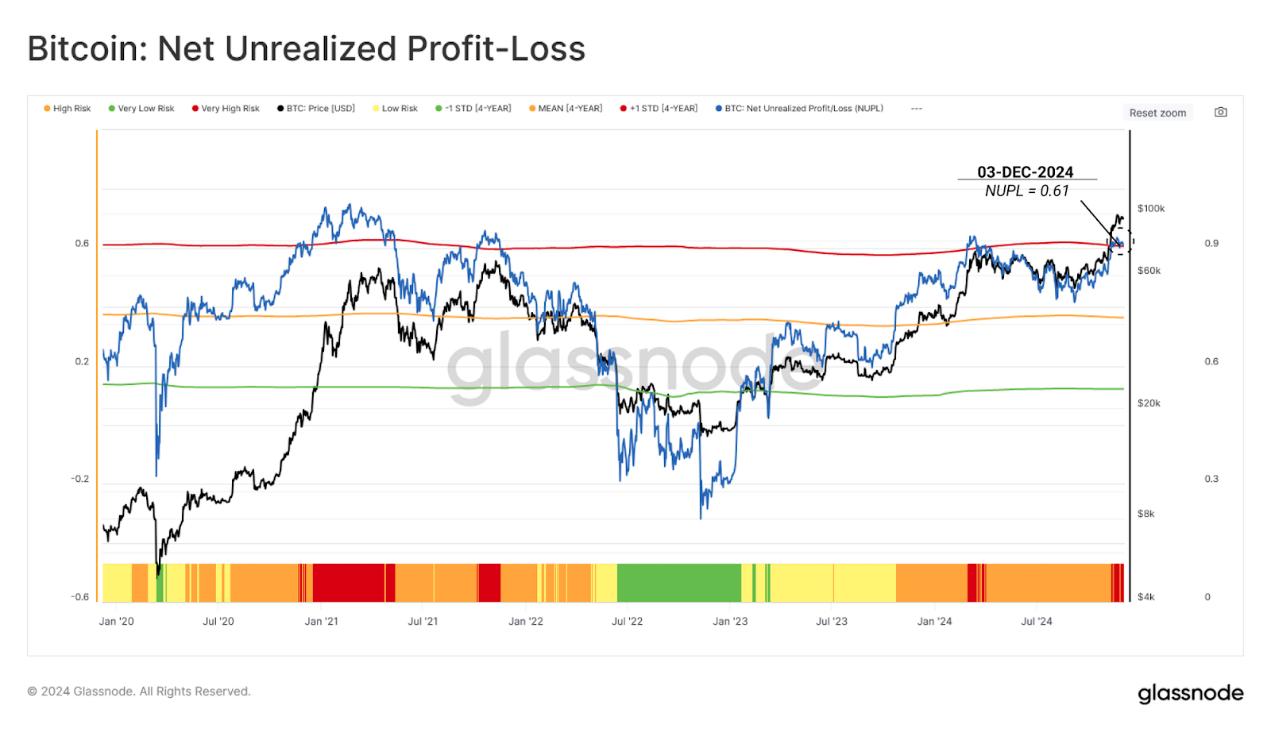
The Net Unrealized Profit/Loss (NUPL) indicator quantifies the total profit or loss held by the market as a percentage of market capitalization. Taking into account the magnitude of unrealized profit or loss can provide insight into the psychological state of the market.
Based on the profit supply percentage metric mentioned above, NUPL can gain greater insight into the magnitude of profitability, and therefore, driving investor sentiment – from optimism to excitement and fear.
NUPL is divided into four risk levels:
- Very High Risk: NUPL exceeds 0.59, one standard deviation above the 4-year average. This phase is marked by extreme unrealized profits, reflecting market exuberance and heightened correction risk.
- High Risk: NUPL between 0.35 and 0.59 indicates that the market is profitable but has not yet reached exuberance levels.
- Low Risk: NUPL between 0.12 and 0.35 indicates moderate profitability and is usually in a stabilization or early recovery phase.
- Very Low Risk: NUPL breaks below 0.12, coinciding with market capitulation and bottom finding phase in a bear market.
As prices break above $88,000, NUPL also enters the very high risk zone, indicating that the market is now holding extremely high unrealized profits. This high level indicates a greater risk that investors will start to increase selling pressure and take advantage of higher prices and strong new demand.
Data source: Glassnode
3. Measure investor spending patterns
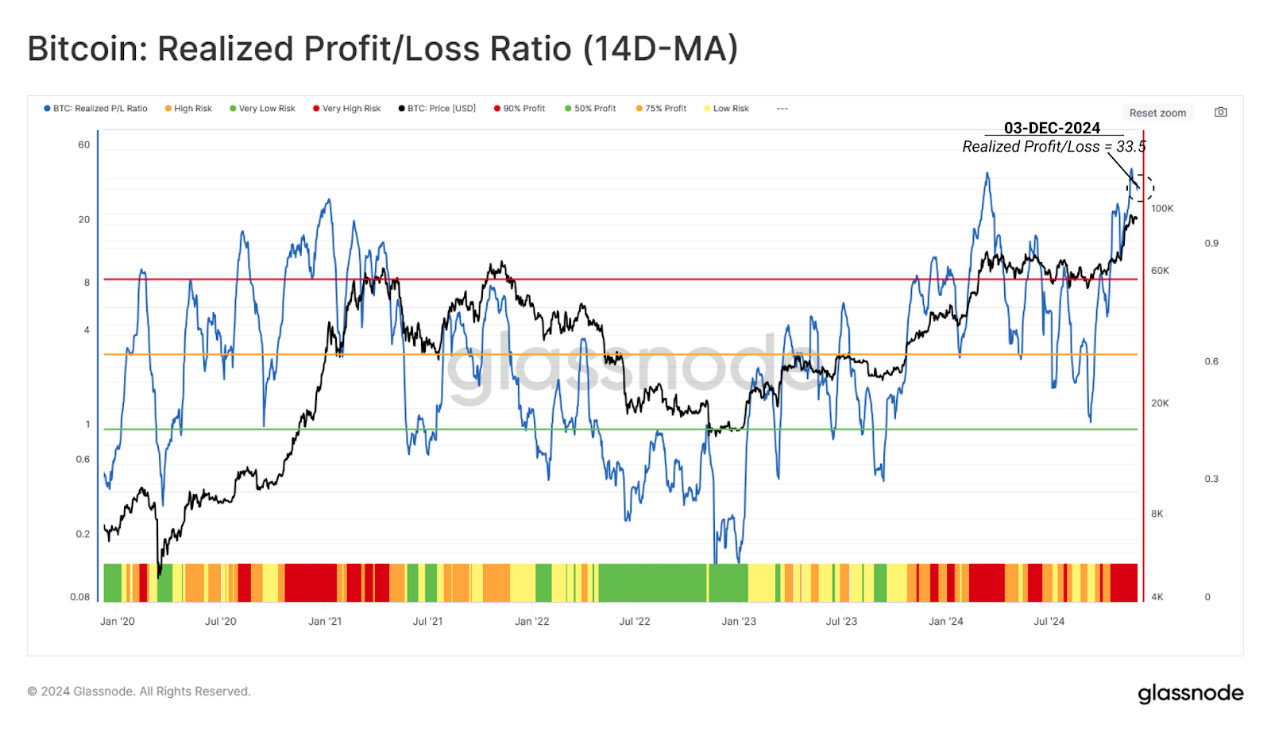
Given the high level of unrealized profits in the system, the realized profit-loss ratio (RPLR) can be used to gauge how investors adjust their spending patterns as Bitcoin approaches the $100,000 level.
RPLR tracks the ratio of profit-taking to loss-making events that occur on-chain, and therefore provides insight into changes in investor behavior. Other factors can be filtered by applying a 14-day moving average (14D-MA) to provide a clearer picture of the macro trend.
The RPLR framework divides market risk into four levels:
- Very High Risk: RPLR over 9, indicating that more than 90% of tokens moved on-chain are being used for profit — a common sign of exhausted demand
- High risk: RPLR between 3 and 9, with 75%-90% of tokens held for profit, usually seen at market peaks
- Low risk: RPLR drops below 3, indicating a transitional phase where profit and loss expenditures are balanced (1 < RPLR < 3)
- Very Low Risk: RPLR drops below 1, dominated by losing coins, usually observed during market capitulation
The RPLR indicator has also entered the very high risk zone, highlighting the intensity of profit-taking activity during this price discovery rally and the potential for creating indirect supply to the market.
Data source: Glassnode
Cooling
While all three indicators are in very high risk territory, it is worth noting that these conditions are typical of explosive rallies during price discovery.
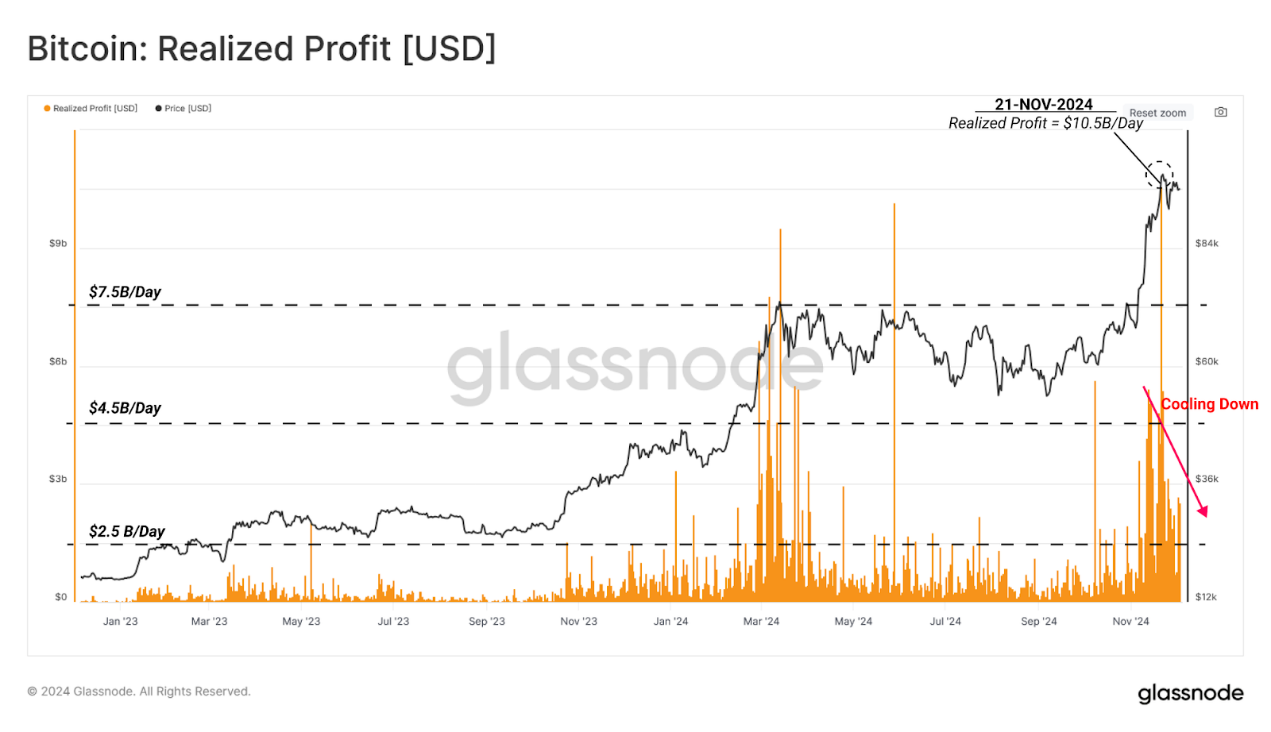
This assessment can be supported by looking at the speed at which these indicators have cooled over the past week. In particular, focus on realized profits and perpetual contract funding rates, respectively, as key indicators of sell-side pressure and excessive leverage demand.
Realized profits, which track the dollar gains of mobile tokens, peaked at $10.5 billion per day during Bitcoin's march toward $100,000. They have since fallen to around $2.5 billion per day, a 76% drop. This sharp decline suggests a clear cooling, suggesting that profit-taking may be more impulsive than sustained.
Data source: Glassnode
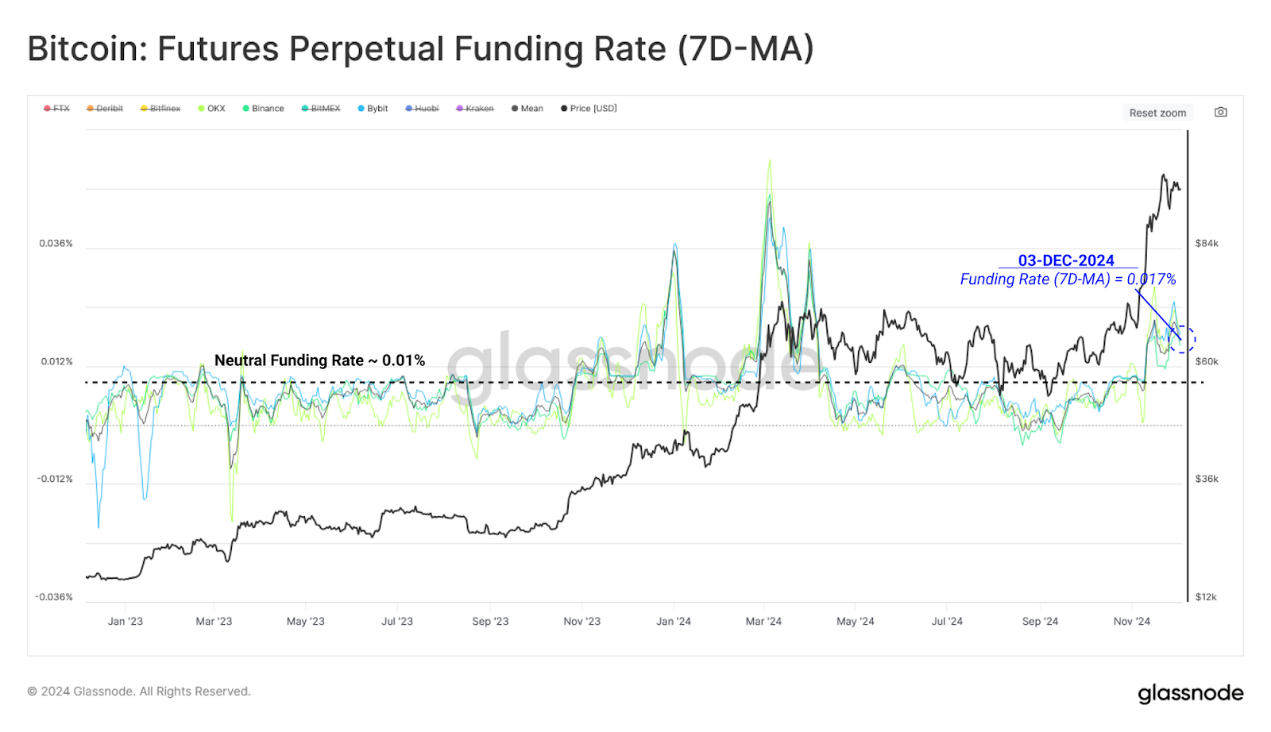
The perpetual contract market also confirms this insight. As speculative demand begins to stabilize, funding rates begin to stabilize.
Funding rates, which measure the interest cost of holding open perpetual futures contracts, in this case, what long traders have to pay to shorts, have spiked during the rally, but not as much as in March.
If the funding rate starts to fall, it indicates that a large amount of long leverage is beginning to exit the market, while a renewed rise may indicate that long risk is increasing.
Data source: Glassnode
in conclusion
Bitcoin’s recent rally to a new all-time high of $99,400 marked a pivotal moment in this cycle, propelling the market into a price discovery phase. The breakout of the long-standing $54,000 to $74,000 price range drove a large amount of supply into unrealized profits and triggered several high indicators used to track short-term overheating risks.
At the same time, some indicators have begun to cool down, such as the decline in realized profits and perpetual contract funding rates. This indicates that excessive speculative interest has slowed down and spot seller activity has decreased net. The Bitcoin market is trying to find balance again, and the bottom of the current supply density cluster is $88,000.
Related reading: Trump nominates Paul Atkins as SEC Chairman, Bitcoin breaks through $100,000, and cryptocurrency regulation is about to open a new chapter


You May Also Like

Liventus Acquires Tamarack to Become the Most Comprehensive Technology Partner for Equipment Finance Organizations

Trump's revenge tour will come back to bite him in the you-know-what

Ethereum price today $2,130 — bearish below $2,150; $2,116 key


