The Role of Financial Data Analytics in Crypto, Forex, and Commodity Markets
The post The Role of Financial Data Analytics in Crypto, Forex, and Commodity Markets appeared first on Coinpedia Fintech News
Modern financial markets don’t wait for anyone. Bitcoin can drop 15% before your morning coffee gets cold. The euro shifts against the dollar the moment a central bank speaks. Gold prices spike when geopolitical tension rises, and oil reacts to a tweet. For traders, investors, and fintech platforms operating in this environment, gut instinct alone is no longer enough. Real-time data and the ability to make sense of it quickly have become the defining edge, the difference between a well-timed position and a painful loss.
The challenge isn’t access to data, but that markets generate huge volumes of it every single second. Crypto exchanges broadcast price ticks around the clock. Currency pairs update in milliseconds. Gold and oil prices shift with every trade. The real problem is that raw numbers don’t tell you anything on their own. A price without context is just noise. What separates successful market participants from the rest is the ability to transform that constant stream of crypto prices, exchange rates, and commodity valuations into meaningful, actionable insights.
This article breaks down exactly how financial data analytics works across three of the most active and volatile asset classes: cryptocurrency, forex, and commodities. You’ll learn what financial data analytics actually means in plain terms, why real-time market data is critical to every layer of modern finance, and how analytics powers smarter trading, better forecasting, and stronger decision-making. Whether you’re building a fintech product, managing a portfolio, or simply trying to understand how institutional platforms stay ahead, this is where it starts.
What is Financial Data Analytics?
At its core, financial data analytics is the process of collecting, organizing, and examining market data to find patterns, trends, and useful insights. Think of it as the difference between watching a stock ticker scroll by and actually understanding what those numbers mean:
- Where prices are heading
- Why they moved
- What might happen next
It works across several types of real-time price feeds showing what an asset is worth right now, historical data revealing how it has behaved over days, months, or years, and volume data showing how much is being traded at any given time. When you combine these data points, you begin to see the bigger market picture, not just isolated numbers.
In practice, financial data analytics is used by traders looking for entry and exit signals, by fintech apps displaying live market data to users, by analysts building economic forecasts, and by financial institutions managing risk across large portfolios. Any platform that analyzes crypto prices, exchange rates, and gold or oil trends is performing financial data analytics continuously and at scale.
Why Financial Data Analytics Matters in Modern Financial Markets
Speed and accuracy are everything in financial markets. When Bitcoin dropped over 30% in a single day in May 2021, traders who had analytics systems tracking momentum, volume spikes, and sentiment indicators responded within minutes. Those relying on manual observation reacted far too late. Analytics doesn’t just help you react faster; it also helps you anticipate market moves.
Risk reduction is another major benefit. Analysts track correlations between assets, such as how gold tends to rise when equity markets fall or how oil prices influence inflation-linked currencies. These relationships, when identified through data, allow investors to hedge more effectively and avoid concentrating risk in assets that move together.
Market trend identification is where analytics shines most visibly. Platforms process live market data from multiple sources, detect patterns across asset classes, and surface trends that would take a human analyst hours to spot manually. Data-driven investing, once the domain of large hedge funds, is now accessible to individual investors through retail trading apps that run analytics in the background.
When forex volatility spikes due to a surprise central bank decision, or when gold prices shift sharply during an inflation report, analytics platforms flag these movements in real time and help users understand their implications not hours later, but as they happen.
The Role of Financial Data Analytics in Crypto Markets
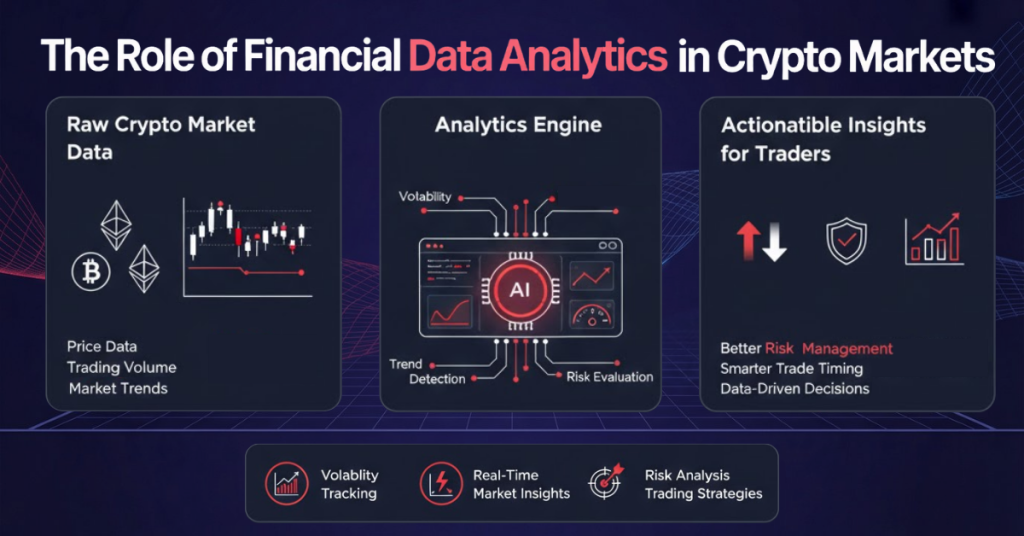
Crypto markets operate 24 hours a day, seven days a week, with no closing bell. This creates a continuous stream of price data, trading volume, order book activity, and on-chain metrics that never stops. For traders and platforms operating in this space, financial data analytics isn’t optional. It’s the engine that makes the market navigable.
Real-time crypto price tracking allows exchanges and trading dashboards to give users accurate, up-to-the-second valuations across hundreds of tokens. Beyond price, market sentiment analysis pulls signals from social media, search trends, news mentions, and on-chain activity to gauge whether market participants are feeling bullish or bearish, often before that sentiment shows up in price.
Volatility analysis is especially critical in crypto markets because price swings are much sharper than in traditional assets:
- Traders monitor how violently a token’s price moves over time.
- They compare past volatility with current market behavior.
- They adjust position sizes based on risk levels.
- They use volatility data to set smarter stop-loss and take-profit levels.
- They reduce emotional decisions by relying on structured risk insights.
Trading signals and predictive insights are the downstream output of all this analysis. Portfolio tracking apps surface when a holding is diverging from its typical pattern. Exchange platforms alert users to unusual volume spikes. Trading dashboards generate buy and sell signals based on technical indicators calculated from live data. All of it runs on financial data analytics, working continuously in the background.
How Financial Data Analytics Powers Forex Market Insights
The foreign exchange market is the largest and most liquid financial market in the world, with over $7 trillion traded daily. Exchange rate data sits at the center of forex analytics, as every trade, every hedge, every international transaction depends on accurate, real-time currency valuations. When that data is stale or inaccurate, the consequences ripple across every decision built on top of it.
Currency fluctuation analysis looks at how pairs like EUR/USD, GBP/JPY, or USD/TRY move relative to economic indicators, interest rate decisions, and geopolitical events. Analytics platforms track these correlations and flag when a currency pair is approaching a historically significant level or when volatility is expanding unexpectedly.
Global economic impact on forex trends is one of the most complex areas of financial data analytics. A jobs report in the US, an inflation print in the eurozone, or a rate decision from the Bank of Japan all move currency markets within milliseconds. Fintech platforms rely on accurate exchange rate data sources to ensure their analytics models are working from current, reliable inputs. Using outdated exchange rate data can quickly lead to misleading insights and poor financial decisions.
Real-time currency tracking also matters for businesses beyond pure trading. Multinational companies monitor exchange rates to manage FX risk on international revenue. Payment platforms use live rate data to price cross-border transactions fairly. All of these use cases depend on the same foundation: accurate, low-latency forex data feeding into well-built analytics systems.
Financial Data Analytics in Commodity Markets (Gold, Oil, and Beyond)
Commodity markets carry some of the most important price signals in the global economy. Gold, oil, natural gas, wheat, and copper are not just trading instruments. They’re indicators of economic health, inflation expectations, supply chain stability, and geopolitical risk. Financial data analytics turns commodity price data into a window onto these broader dynamics.
Gold price analytics is a prime example. Gold has historically served as a safe-haven asset when inflation rises, when currencies weaken, or when equity markets fall sharply. Gold tends to attract capital. Analytics models track these correlations, helping investors time gold allocations relative to macroeconomic conditions. During periods of high inflation in 2022, gold analytics helped portfolio managers understand when the metal was pricing in rate expectations versus acting as a pure inflation hedge.
Oil market trend analysis is equally rich with signals. Crude oil prices react to OPEC decisions, geopolitical conflicts in major producing regions, global demand forecasts, and inventory reports from the US Energy Information Administration. Analytics platforms tracking commodity price data from reliable providers allow analysts to overlay these factors and build forward-looking price models rather than simply reacting to yesterday’s close.
Commodity price forecasting combines historical price data, seasonal patterns, supply and demand models, and macroeconomic inputs. The inflation-commodity correlation is one of the most studied relationships in financial analytics. Rising commodity prices, particularly oil and food, are often early indicators of broader inflationary pressure. When analysts track these inputs systematically, they gain a significant lead on markets that are still reacting to lagging data.
How Real-Time Market Data Enhances Financial Data Analytics
There’s a fundamental difference between static data and live data, and in financial markets, that difference is everything. Static data shows where prices were, while real-time data shows where the market stands right now. Analytics built on yesterday’s close is useful for research. Analytics built on live price feeds is what drives actual trading decisions.
Live price feeds give analytics models the inputs they need to stay accurate. When a model is calculating momentum, it needs current prices. When a risk system is checking exposure limits, it needs to know what assets are worth right now, not two minutes ago. Even a small data latency introduces inaccuracy that compounds across a portfolio.
The quality of forecasting and decision-making is directly linked to data freshness. Analytics models trained on historical data but fed live inputs can detect when current market behavior is diverging from established patterns. That divergence is often where the most important signals live, a crypto asset breaking out of its trading range, a currency pair approaching a key technical level, or a commodity price reacting to a supply shock in real time. Without live data, those signals arrive too late to act on.
Key Use Cases of Financial Data Analytics in Fintech and Trading Platforms
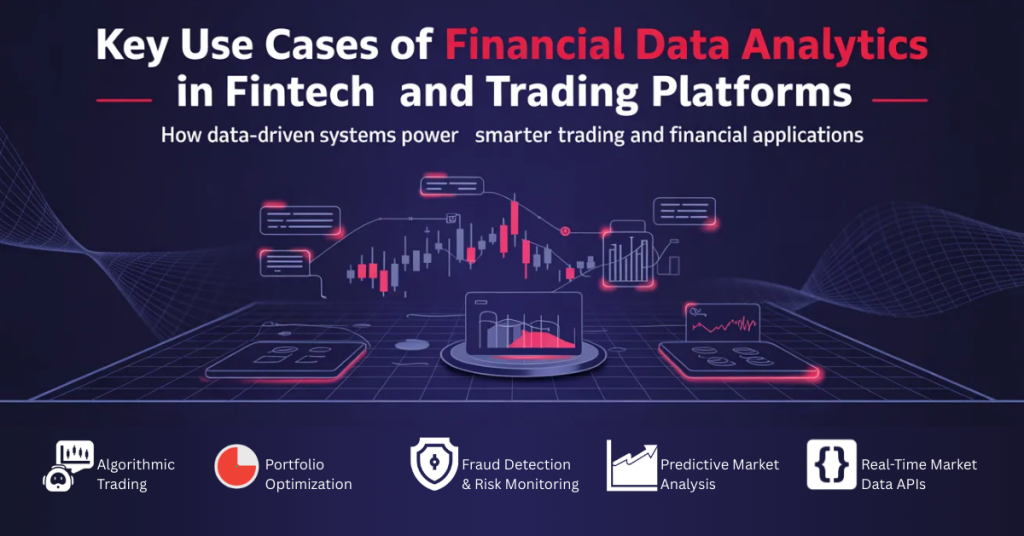
The practical applications of financial data analytics have expanded dramatically as fintech infrastructure has matured. What once required dedicated quantitative teams at large institutions now runs inside consumer-facing apps used by millions of retail investors.
Trading apps use analytics to generate signals, display market context, and help users make faster decisions. Investment platforms track portfolio performance against benchmarks in real time and surface rebalancing opportunities based on market movements. Robo-advisors apply analytics continuously to manage asset allocation automatically, adjusting portfolios as market conditions shift without requiring manual input from users.
Financial dashboards aggregate data across multiple asset classes, such as crypto, forex, and commodities, into a single interface, using analytics to highlight what matters most at any given moment. Risk management systems are perhaps the highest-stakes application: they monitor exposure across positions, calculate value-at-risk in real time, and trigger alerts when predefined thresholds are breached.
What all of these platforms share is a dependence on high-quality analytics working continuously behind the scenes. The user experience, clean charts, helpful alerts, and automated decisions are the surface. Financial data analytics is the infrastructure that makes it all function.
Future of Financial Data Analytics in Multi-Asset Markets
The next chapter of financial data analytics is being written by artificial intelligence and machine learning. AI-driven analytics systems go beyond predefined patterns. They can discover new trends in data automatically and adapt to market conditions that have never appeared before. Predictive market modeling is becoming more sophisticated, with models that incorporate alternative data sources like satellite imagery of oil storage facilities, shipping traffic as a proxy for trade volume, and real-time news sentiment alongside traditional price and volume inputs.
Cross-market analysis examining crypto, forex, and commodity markets simultaneously to identify inter-asset relationships is an increasingly important frontier. When Bitcoin rallies alongside gold during periods of dollar weakness, or when oil prices and inflation-linked currencies move in sync, analytics systems that watch multiple markets at once can surface insights that single-asset analysis misses entirely.
The result is an emerging data-driven financial ecosystem where analytics is embedded at every layer, from individual trade execution to institutional portfolio construction to macroeconomic forecasting. The tools will become more powerful and more accessible simultaneously, democratizing insights that were once available only to the most resourced players in global markets.
The Foundation of Smarter Financial Decision-Making
Financial data analytics connects crypto, forex, and commodity markets through a common thread: the ability to turn constant streams of price data, exchange rates, and market signals into clear insights. Whether it’s a trader monitoring Bitcoin volatility, an analyst tracking gold during an inflationary cycle, or a fintech platform giving users live currency conversion rates, the same analytical infrastructure is at work processing, interpreting, and surfacing what matters.
As global markets grow more interconnected and data volumes continue to expand, the competitive advantage will belong to those who can move from raw data to insight faster and more accurately than everyone else. This isn’t a future state; it is already the reality for leading trading platforms, fintech companies, and institutional investors. The gap between data-driven participants and those operating without analytics support will only widen.
Financial data analytics is no longer a technical advantage reserved for large institutions. It is the foundation of modern financial decision-making, the layer beneath every informed trade, every accurate price displayed to a user, and every risk management system keeping portfolios from catastrophic loss. For any platform, investor, or analyst operating in today’s markets, it isn’t optional. It’s essential.
Frequently Asked Questions
What is financial data analytics in simple terms?
Financial data analytics is the process of analyzing market data like prices, trading volumes, and exchange rates to find patterns and insights that help traders, investors, and businesses make better decisions. Instead of looking at raw numbers, analytics turns those numbers into a clear story about where markets have been, where they are now, and where they might be heading.
How is financial data analytics used in crypto markets?
In crypto markets, financial data analytics powers real-time price tracking across hundreds of tokens, volatility analysis to help traders manage risk in fast-moving markets, and market sentiment analysis that draws signals from social media and on-chain activity. Trading platforms also use analytics to generate trend predictions and buy or sell signals based on live market data.
Why is real-time data important in financial analytics?
Real-time data ensures analytics models are working from accurate, current inputs rather than outdated information. In fast-moving markets, even a short delay in price data can lead to wrong signals, mispriced risk, or missed opportunities. Live price feeds allow platforms to detect market movements as they happen, making forecasting and decision-making faster and more reliable.
What data is used in financial data analytics?
Financial data analytics draws on a range of data types, including real-time market prices, historical price data, exchange rates between currencies, trading volume, order book depth, and commodity prices for assets like gold and oil. Analytics models combine these inputs, often alongside macroeconomic data and news sentiment, to generate actionable insights across asset classes.
Is financial data analytics useful for traders and investors?
Absolutely. For traders, analytics provides the signals and market context needed to make faster, better-informed decisions. For investors, it supports portfolio monitoring, risk management, and the identification of market trends before they become obvious. Whether you’re an active trader or a long-term investor, analytics removes guesswork and replaces it with data-driven confidence.


You May Also Like

Tokenized China-Linked Equities And ETFs On BNB Chain Explode 2,850% In 2026

Trump's China trip sparks chaos as desperate CEOs chase down aides for invites: report