

Polkadot Surges 41%: The 3 Catalysts Driving DOT’s Breakout
- Polkadot’s first-ever halving on March 14, 2026, will cut token issuance by over 50%, boosting scarcity appeal.
- ETF filings from Grayscale and 21Shares are drawing institutional interest, adding strong demand-side momentum to DOT.
- DOT broke above the daily 20 EMA and $1.40 resistance, with RSI climbing toward 59 and MACD turning bullish.
Polkadot surges 41%, drawing widespread attention across the cryptocurrency market this week. DOT is trading at $1.61 as of writing, posting a 9.61% gain in the last 24 hours alone.
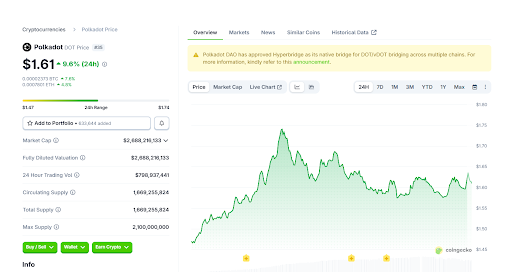 Catalysts Driving DOT’s Breakout Source: CoinGecko
The 7-day performance stands at 23.52%, with trading volume hitting $762,562,234. Three distinct catalysts appear to be working together behind this sharp price move.
A Historic Halving Event on the Horizon
Polkadots first halving event is set for the 14th of March 2026 and it’s already affecting the marketplace.
This will decrease annual token allocation by 50% or more which will change the structure of DOT to move toward an anti-inflationary supply model.
This type of structural change is typically not missed by traders or long-term holders. The scarcity narrative that follows a halving event will build a head of steam leading up to it.
Traders are anticipating that this reduction in available supply will create upward price pressure.That behavior is clearly reflected in DOT’s recent performance.
Crypto analyst Lark Davis pointed to the halving as one of the primary drivers behind the current rally.
He noted that the shift to a deflationary model marks a meaningful evolution for the Polkadot network. The market appears to be pricing that transition in ahead of schedule.
ETF Filings Spark Institutional Interest
Potential Polkadot ETF filings from institutions like Grayscale and 21Shares have added another layer to the rally.
These filings represent growing demand for regulated exposure to DOT among traditional investors. The possibility of a listed ETF product has fueled anticipation across both retail and institutional circles.
Past ETF-related developments in Bitcoin and Ethereum showed how quickly sentiment can shift on such news.
A similar dynamic is now playing out around Polkadot, with investors front-running potential approval. The market is responding to the demand-side narrative just as strongly as the supply-side one.
Together, the halving and ETF storylines are reinforcing each other at the same time. That convergence has made the current move more than a short-term trade for many participants. It has given the rally a structural foundation that purely speculative moves often lack.
A Clean Technical Breakout on the Charts
DOT broke above its daily 20 EMA and cleared horizontal resistance near the $1.40 level. Price is now holding firm support at $1.23, a zone that attracted strong buying interest. That setup gave momentum traders a clear technical signal to enter the market.
The MACD crossed bullishly shortly after the breakout, with the histogram flipping green above the zero line.
The signal line is curling upward, pointing to expanding short-term momentum. While the move is measured, it reflects a clear shift away from the prior bearish pressure.
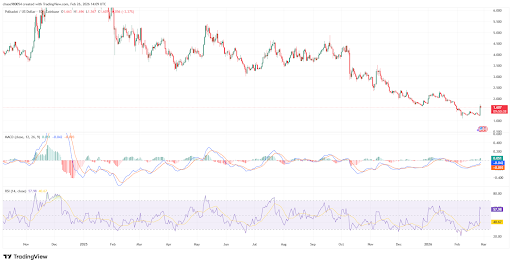 Technical Breakout on the Charts. Source: TradingView
The RSI has recovered sharply from sub-30 levels recorded earlier in February. It is now pushing toward the upper mid-range near 59, showing renewed buying activity across the chart.
The RSI moving average is also turning upward, further confirming that short-term strength is building.
What the Price Action Reflects Right Now
DOT’s current price of $1.61 sits above key resistance levels that held for much of the prior month.
The volume behind this move, over $762 million in 24 hours, adds weight to the breakout. High-volume breakouts above resistance tend to carry more follow-through than low-volume ones.
The alignment of three separate catalysts, a supply event, institutional filings, and a technical breakout, is uncommon in a single trading window.
Each factor alone might produce modest movement, but together they have amplified the reaction. That layered setup is what has kept the momentum going through the week.
Whether DOT can hold and extend these gains will depend on market conditions as the March 14 halving approaches.
Traders will be watching the $1.40 level closely as a new support zone. The next few weeks will likely determine if this breakout develops into a larger trend.
The post Polkadot Surges 41%: The 3 Catalysts Driving DOT’s Breakout appeared first on Live Bitcoin News.


You May Also Like

Bitcoin vs Gold: Which Is the Better Investment in 2026?

OKX Launches X-Perps in Europe: MiFID Regulated Crypto Derivatives with up to 10x Leverage


