

Arbitrum Price Analysis: ARB Up 4% Today- Is a Major Reversal Finally Starting?
The post Arbitrum Price Analysis: ARB Up 4% Today- Is a Major Reversal Finally Starting? appeared first on Coinpedia Fintech News
After nearly two years of relentless downside pressure, Arbitrum (ARB) is showing early signs of stabilization. The token has gained 4% intraday, extending its weekly advance to around 8%, as buyers step in near a historically important support region.
This move is significant, not because of its size, but because of where it’s happening. Arbitrum price is trading near the bottom of a multi-year descending channel, a zone that has previously acted as a base for long-term reversals rather than sustained breakdowns. As a result, market sentiment is beginning to shift from capitulation toward early-stage accumulation.
Wyckoff Accumulation Signals Begin to Emerge
The current price action closely resembles a Wyckoff Accumulation structure, with ARB potentially transitioning from Phase C into early Phase D. This phase is typically marked by false downside moves, followed by sideways compression as supply diminishes. Key signals supporting this view include:
- Sideways consolidation after a sharp impulse drop
- Repeated defenses of the same demand base
- Volatility compression, often seen before expansion phases
Importantly, this does not signal an immediate breakout. Instead, it suggests ARB may be entering a patience zone, where positioning occurs before momentum becomes obvious.
A 96% Drawdown Puts ARB at a Structural Inflection Point
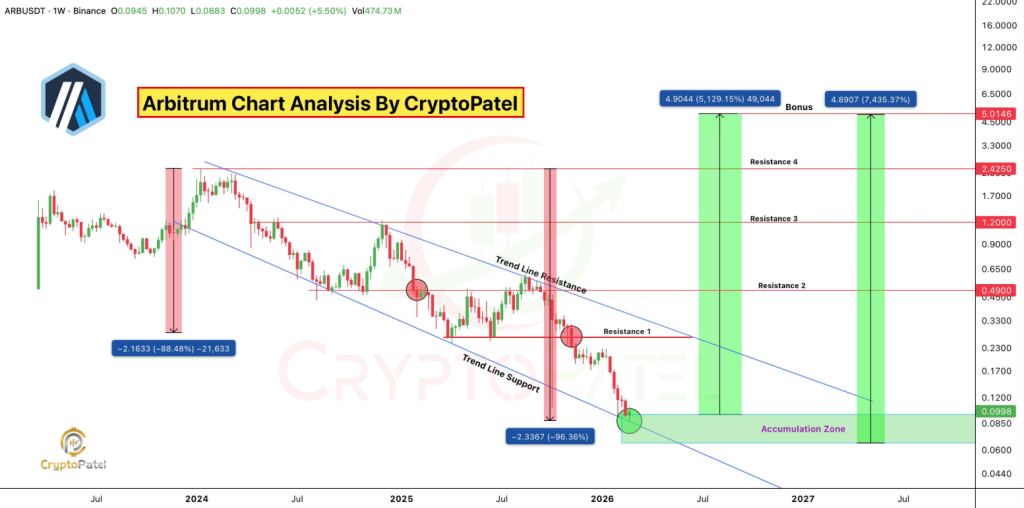
From its cycle high near $2.42, ARB price has corrected by more than 96%, placing it among the most discounted large-cap Layer-2 tokens in the market. While such drawdowns often damage sentiment, they also tend to precede long basing phases where risk becomes more defined. According to the chart structure:
- ARB Price is holding inside a high-timeframe demand zone between $0.09 and $0.06
- This area aligns with historical capitulation wicks, suggesting aggressive selling may be exhausted
- Volume behavior indicates absorption rather than distribution, pointing to buyers quietly soaking up supply
In simple terms, downside momentum is slowing, while long-term participants appear more active at these levels.
Spot Netflows Confirm Quiet Accumulation
On-chain data adds further support to the bullish case. ARB spot netflow charts show consistent net outflows from exchanges, indicating that more tokens are being withdrawn than deposited. This trend is important because:
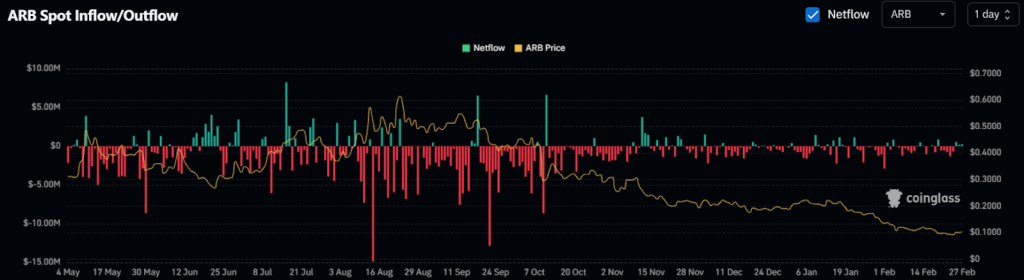
- Exchange outflows typically reduce near-term sell pressure
- They suggest long-term holding or strategic accumulation
- There is no evidence of panic inflows despite price trading near cycle lows
Notably, these net outflows are occurring directly within the high-timeframe demand zone, reinforcing the idea that supply is being absorbed rather than distributed. In simple terms, ARB’s downside appears increasingly constrained due to shrinking liquid supply at critical structural levels.
Key Levels to Watch: What Confirms a Reversal for ARB Token?
For the bullish thesis to strengthen, ARB price must reclaim key resistance levels:
Bullish Confirmation Levels
$0.23 → First bullish break of structure
$0.49 → Descending trendline break and trend-regime shift
Above this zone, upside opens toward $1.20 and $2.42 in extended cycle scenarios
Invalidation Level
Sustained breakdown below $0.06
This would invalidate the accumulation thesis and reopen downside risk
Until that happens, downside remains structurally contained, while upside potential remains asymmetric.
If broader market conditions remain supportive and ARB confirms above key resistance levels, the base could evolve into a larger trend reversal. For now, Arbitrum appears to be building quietly, setting the stage while attention remains elsewhere.


You May Also Like

Bitcoin, Gold, and U.S. Stocks Dive as Trump Pledges to Hit Iran ‘Extremely Hard’

Best Mobile User Retention Tools in 2026

GMatrixs Partners With InsightX To Advance GameFi User Experiences With AI-Powered Web3 Prediction Market Ecosystem


