

Analyst EGRAG insists that XRP has not yet reached its top for this cycle, using Fibonacci targets and a regression model to project higher targets. Notably, XRP has witnessed volatility in recent months. After climbing to a new peak of $3.66 in July 2025 during the broader crypto market upsurge, it has since plunged below the $3 level amid a market-wide correction. Despite this downturn, crypto analyst EGRAG believes XRP might not have reached its final peak for this cycle. He used a combination of linear regression models and Fibonacci targets to suggest XRP could soar as high as $27 before the current cycle ends. XRP Last Leg After the Blue X Print In his recent analysis, EGRAG pointed to a recurring pattern he discovered while using the Lux Algo indicator on XRP's weekly chart. According to data from EGRAG's chart, the appearance of the Blue X symbol often signals a short-term profit-taking point. XRP Lux Algo Premium Indicator However, he explained that in previous cycles, the Blue X sometimes misled traders into thinking a cycle top had arrived when it had not. Specifically, what typically happens is that the Blue X prints when XRP hits a top, followed by a corrective phase to form a local bottom. However, after this correction, a strong upward push toward the true cycle peak emerges, which historically forms without any Blue X appearing at the top. The chart covers XRP's entire price history from 2013 to 2025, separated into three main cycles. Cycle 1 ended around January 2018, while Cycle 2 concluded in April 2021, both topping out near the upper boundary of a long-term linear regression channel. For context, in the 2017/2018 cycle, XRP printed the Blue X when it hit $0.3988 in May 2017. However, after the correction, the true cycle top emerged at $3.3 in January 2018. Also, in the 2020/2021 cycle, XRP saw the Blue X when it soared to $0.79 in November 2020. However, after the pullback, it rose to the true cycle top of $1.96 in April 2021. XRP Blue X Prints in Previous Cycles | EGRAG Crypto XRP Regression Channel and Fib Targets According to EGRAG, each cycle top happened near the upper boundary of a long-term linear regression channel. Notably, this channel features a red median line at its center and blue lines at the top and bottom marking two standard deviations away from the median. During both prior cycles, XRP's price surged from the median line to the upper blue boundary before correcting sharply, creating the foundation for projecting the next cycle peak. In this cycle, XRP saw the Blue X after it reached the $3.4 peak in January 2025. Now, amid the recent correction, XRP trades above the red median line but remains far below the upper blue band, which the model now projects to be near $27 by Oct. 13, 2025. Current Cycle Top | EGRAG Crypto According to EGRAG, this aligns closely with Fibonacci extensions derived from both the 2017 and 2021 cycle peaks. The 2017 cycle top sits between the 1.618 and 1.88 Fibonacci levels at $20.46 and $49.44, while the 2021 peak aligns with the 2.414 and 2.618 levels at $23.49 and $34.08. The $27 target falls comfortably within both ranges. https://twitter.com/egragcrypto/status/1962073712468922450 Despite this optimistic projection, there is uncertainty. From its current level of around $2.72, XRP would need to rally more than 892% to reach $27. According to EGRAG, traders should lock in profits when possible.Analyst EGRAG insists that XRP has not yet reached its top for this cycle, using Fibonacci targets and a regression model to project higher targets. Notably, XRP has witnessed volatility in recent months. After climbing to a new peak of $3.66 in July 2025 during the broader crypto market upsurge, it has since plunged below the $3 level amid a market-wide correction. Despite this downturn, crypto analyst EGRAG believes XRP might not have reached its final peak for this cycle. He used a combination of linear regression models and Fibonacci targets to suggest XRP could soar as high as $27 before the current cycle ends. XRP Last Leg After the Blue X Print In his recent analysis, EGRAG pointed to a recurring pattern he discovered while using the Lux Algo indicator on XRP's weekly chart. According to data from EGRAG's chart, the appearance of the Blue X symbol often signals a short-term profit-taking point. XRP Lux Algo Premium Indicator However, he explained that in previous cycles, the Blue X sometimes misled traders into thinking a cycle top had arrived when it had not. Specifically, what typically happens is that the Blue X prints when XRP hits a top, followed by a corrective phase to form a local bottom. However, after this correction, a strong upward push toward the true cycle peak emerges, which historically forms without any Blue X appearing at the top. The chart covers XRP's entire price history from 2013 to 2025, separated into three main cycles. Cycle 1 ended around January 2018, while Cycle 2 concluded in April 2021, both topping out near the upper boundary of a long-term linear regression channel. For context, in the 2017/2018 cycle, XRP printed the Blue X when it hit $0.3988 in May 2017. However, after the correction, the true cycle top emerged at $3.3 in January 2018. Also, in the 2020/2021 cycle, XRP saw the Blue X when it soared to $0.79 in November 2020. However, after the pullback, it rose to the true cycle top of $1.96 in April 2021. XRP Blue X Prints in Previous Cycles | EGRAG Crypto XRP Regression Channel and Fib Targets According to EGRAG, each cycle top happened near the upper boundary of a long-term linear regression channel. Notably, this channel features a red median line at its center and blue lines at the top and bottom marking two standard deviations away from the median. During both prior cycles, XRP's price surged from the median line to the upper blue boundary before correcting sharply, creating the foundation for projecting the next cycle peak. In this cycle, XRP saw the Blue X after it reached the $3.4 peak in January 2025. Now, amid the recent correction, XRP trades above the red median line but remains far below the upper blue band, which the model now projects to be near $27 by Oct. 13, 2025. Current Cycle Top | EGRAG Crypto According to EGRAG, this aligns closely with Fibonacci extensions derived from both the 2017 and 2021 cycle peaks. The 2017 cycle top sits between the 1.618 and 1.88 Fibonacci levels at $20.46 and $49.44, while the 2021 peak aligns with the 2.414 and 2.618 levels at $23.49 and $34.08. The $27 target falls comfortably within both ranges. https://twitter.com/egragcrypto/status/1962073712468922450 Despite this optimistic projection, there is uncertainty. From its current level of around $2.72, XRP would need to rally more than 892% to reach $27. According to EGRAG, traders should lock in profits when possible.
XRP Last Leg: Analyst Uses Fib and Regression Model to Predict When XRP May Hit $27 This Cycle
For feedback or concerns regarding this content, please contact us at crypto.news@mexc.com
Analyst EGRAG insists that XRP has not yet reached its top for this cycle, using Fibonacci targets and a regression model to project higher targets. Notably, XRP has witnessed volatility in recent months. After climbing to a new peak of $3.66 in July 2025 during the broader crypto market upsurge, it has since plunged below the $3 level amid a market-wide correction. Despite this downturn, crypto analyst EGRAG believes XRP might not have reached its final peak for this cycle. He used a combination of linear regression models and Fibonacci targets to suggest XRP could soar as high as $27 before the current cycle ends. XRP Last Leg After the Blue X Print In his recent analysis, EGRAG pointed to a recurring pattern he discovered while using the Lux Algo indicator on XRP's weekly chart. According to data from EGRAG's chart, the appearance of the Blue X symbol often signals a short-term profit-taking point. 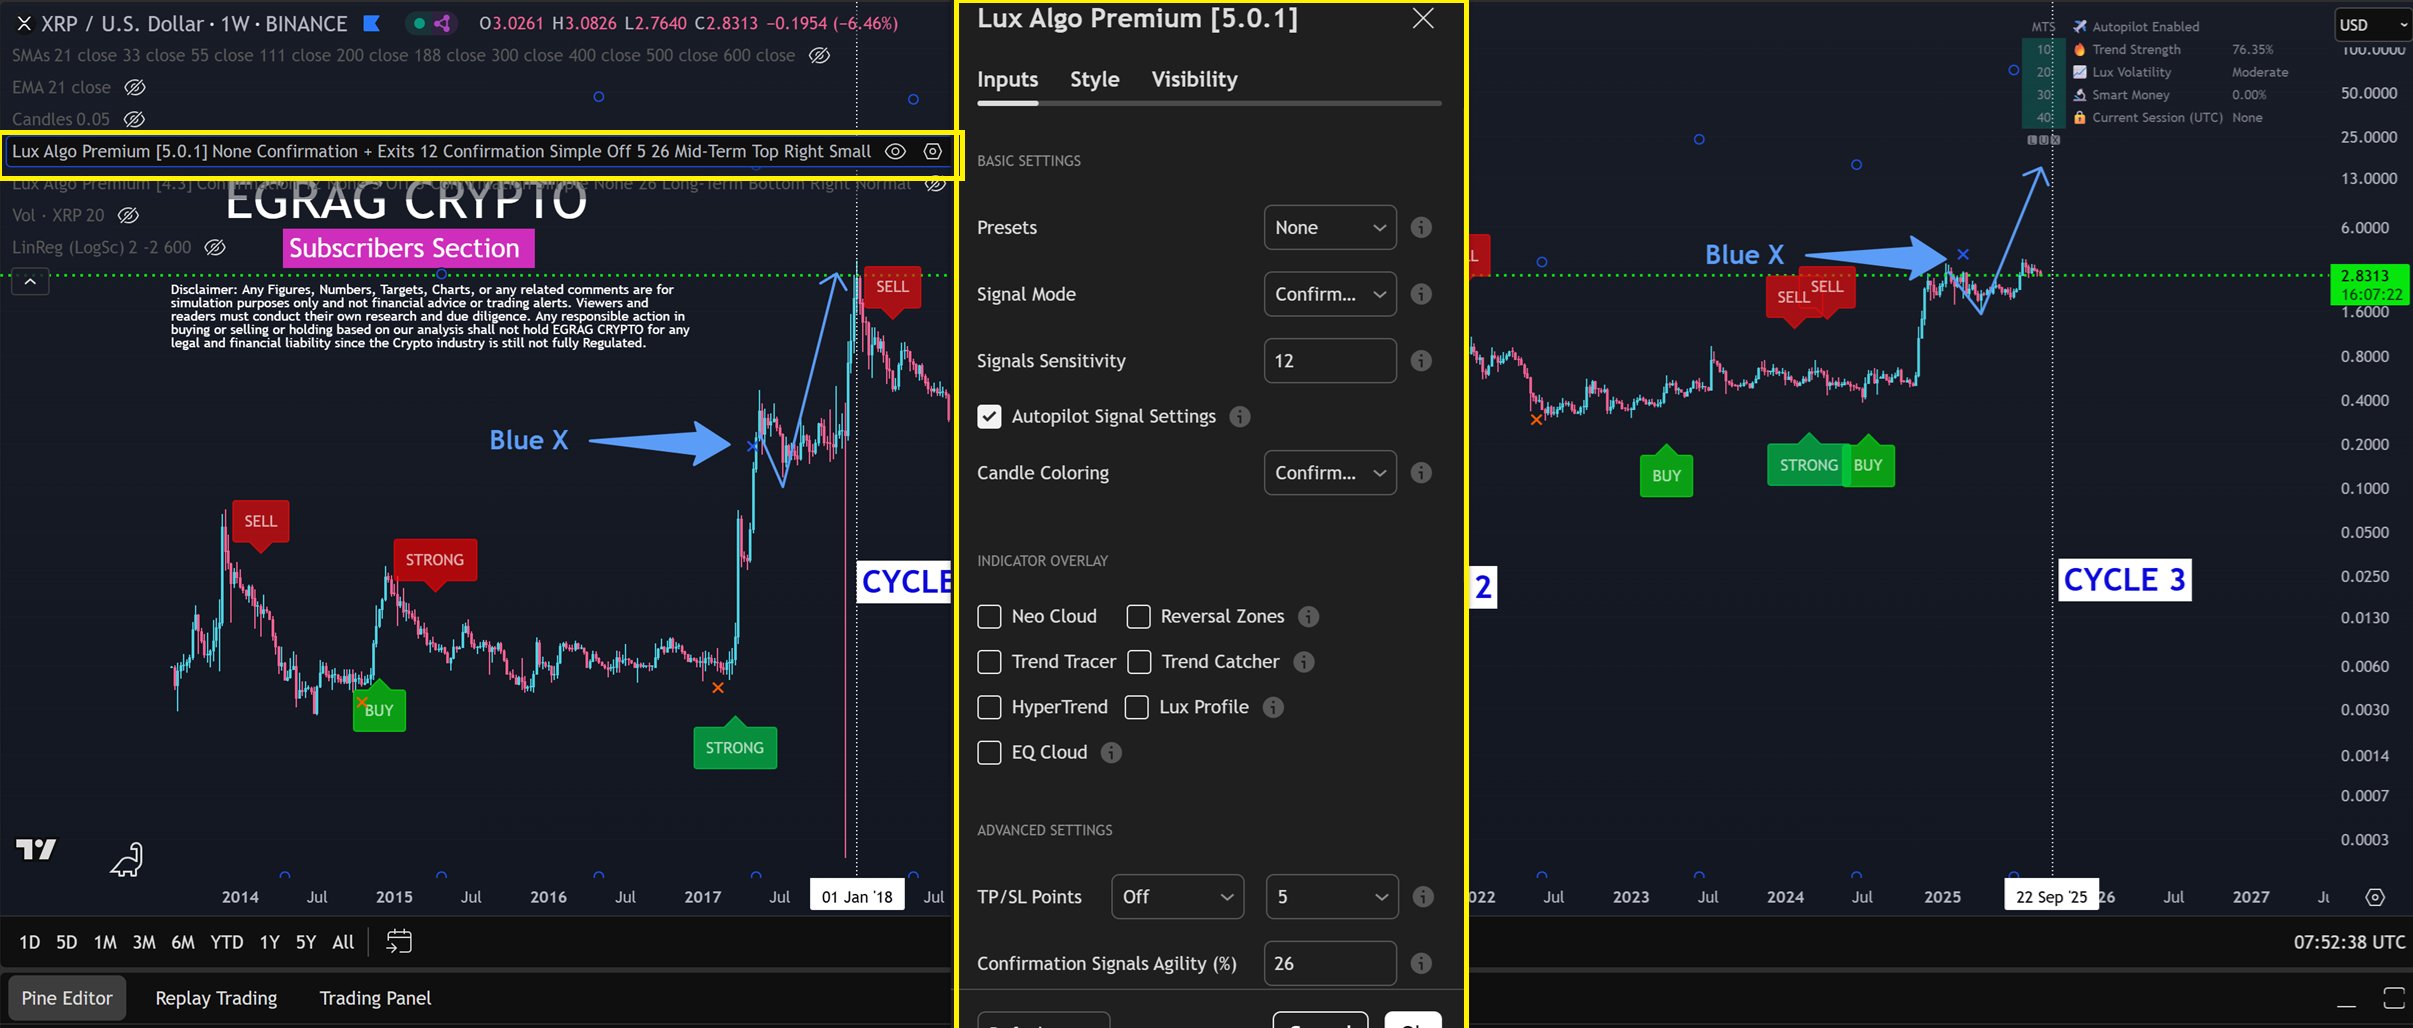 XRP Lux Algo Premium Indicator However, he explained that in previous cycles, the Blue X sometimes misled traders into thinking a cycle top had arrived when it had not. Specifically, what typically happens is that the Blue X prints when XRP hits a top, followed by a corrective phase to form a local bottom. However, after this correction, a strong upward push toward the true cycle peak emerges, which historically forms without any Blue X appearing at the top. The chart covers XRP's entire price history from 2013 to 2025, separated into three main cycles. Cycle 1 ended around January 2018, while Cycle 2 concluded in April 2021, both topping out near the upper boundary of a long-term linear regression channel. For context, in the 2017/2018 cycle, XRP printed the Blue X when it hit $0.3988 in May 2017. However, after the correction, the true cycle top emerged at $3.3 in January 2018. Also, in the 2020/2021 cycle, XRP saw the Blue X when it soared to $0.79 in November 2020. However, after the pullback, it rose to the true cycle top of $1.96 in April 2021.
  XRP Blue X Prints in Previous Cycles | EGRAG Crypto XRP Regression Channel and Fib Targets According to EGRAG, each cycle top happened near the upper boundary of a long-term linear regression channel. Notably, this channel features a red median line at its center and blue lines at the top and bottom marking two standard deviations away from the median. During both prior cycles, XRP's price surged from the median line to the upper blue boundary before correcting sharply, creating the foundation for projecting the next cycle peak. In this cycle, XRP saw the Blue X after it reached the $3.4 peak in January 2025. Now, amid the recent correction, XRP trades above the red median line but remains far below the upper blue band, which the model now projects to be near $27 by Oct. 13, 2025.
 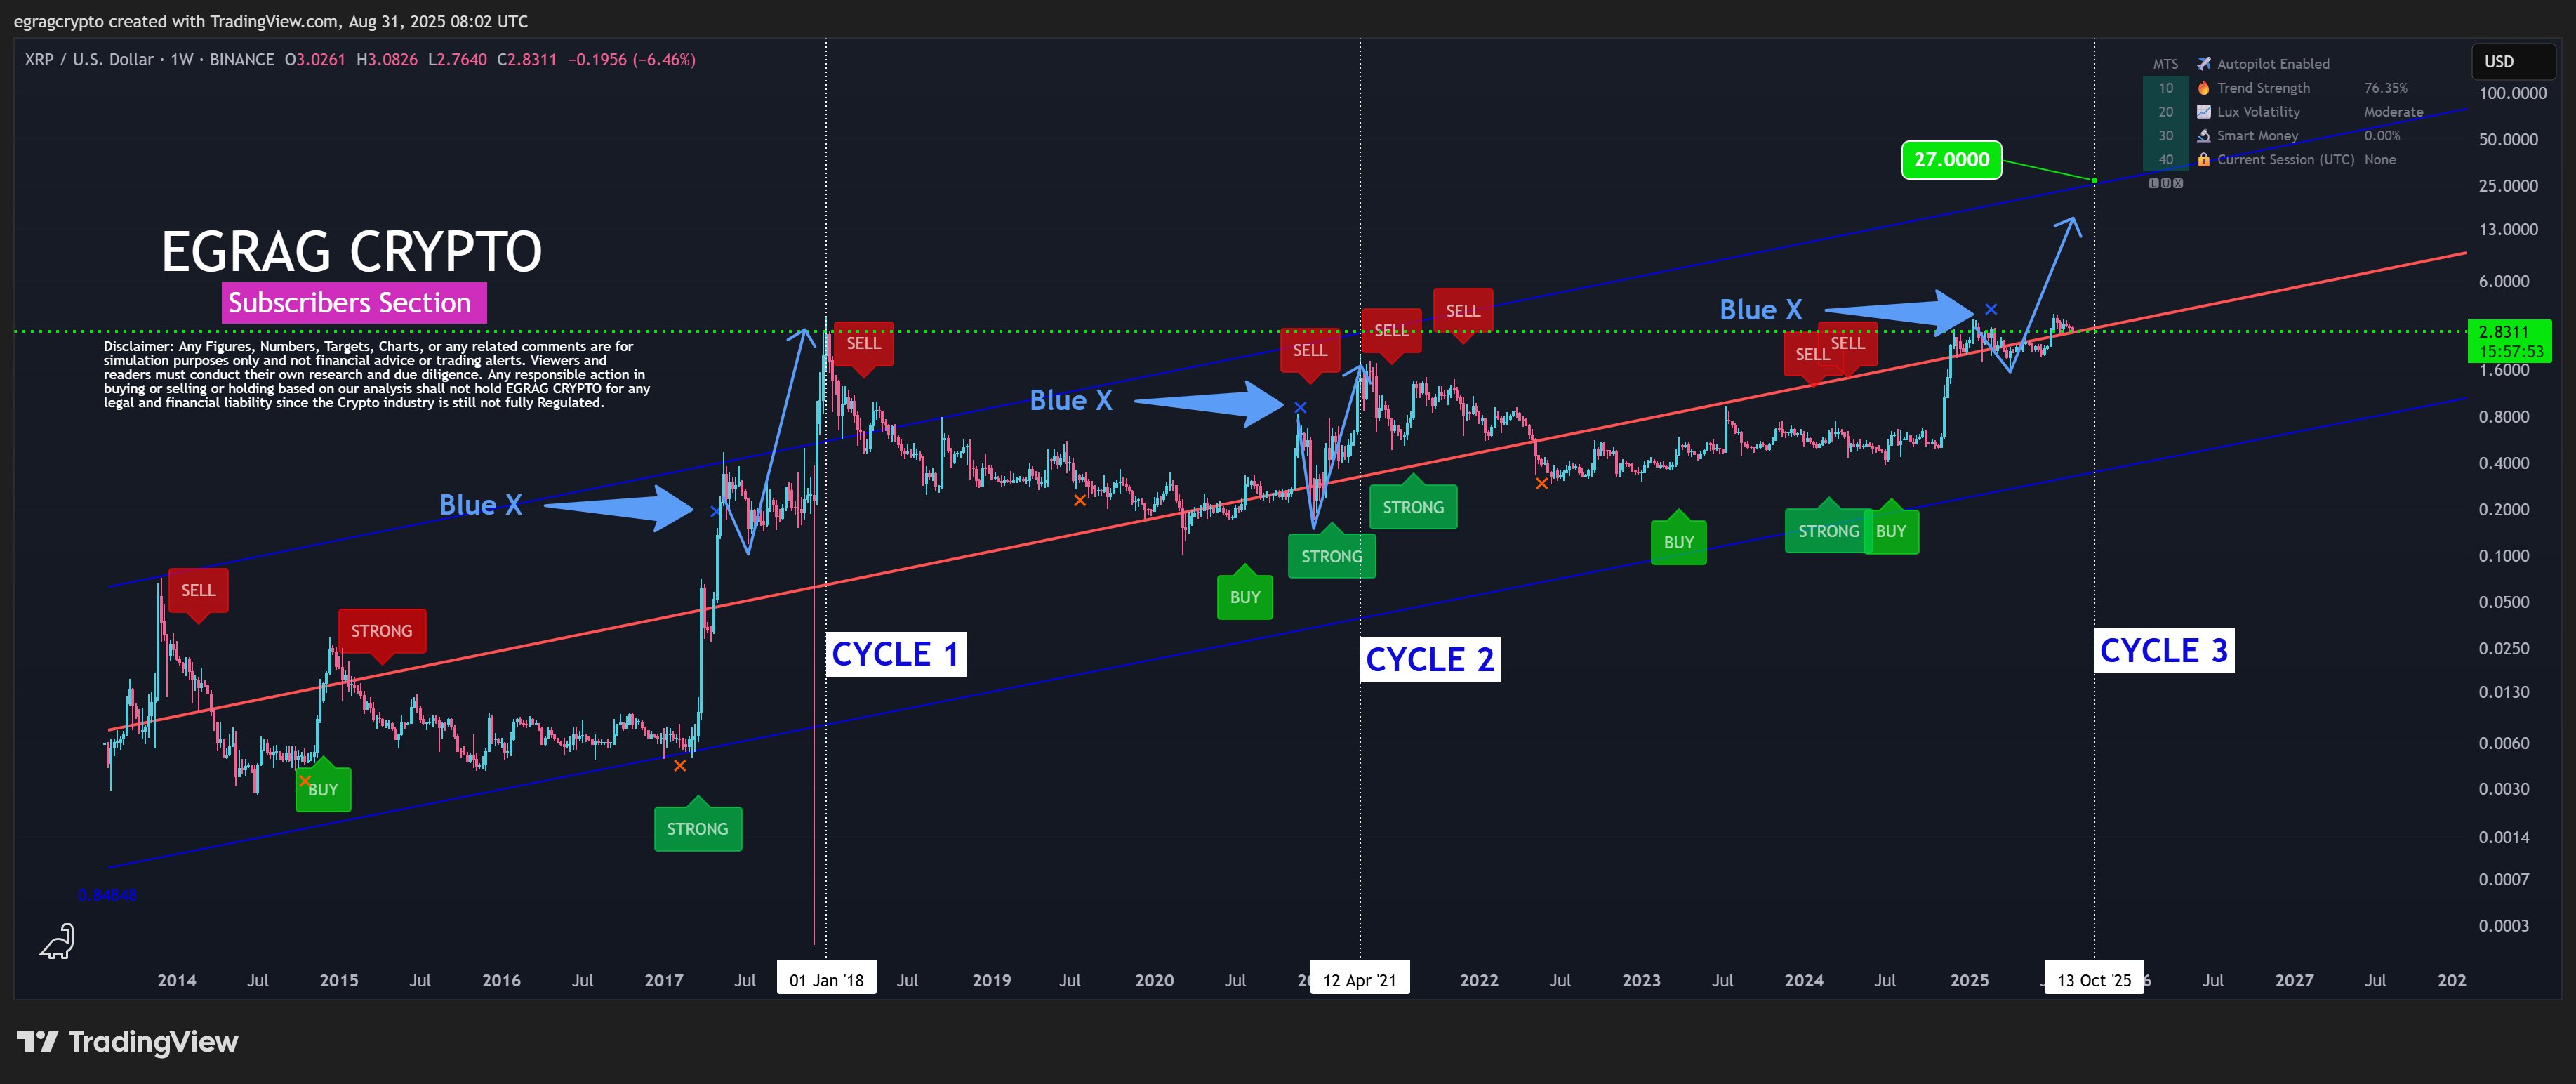 Current Cycle Top | EGRAG Crypto According to EGRAG, this aligns closely with Fibonacci extensions derived from both the 2017 and 2021 cycle peaks. The 2017 cycle top sits between the 1.618 and 1.88 Fibonacci levels at $20.46 and $49.44, while the 2021 peak aligns with the 2.414 and 2.618 levels at $23.49 and $34.08. The $27 target falls comfortably within both ranges. https://twitter.com/egragcrypto/status/1962073712468922450 Despite this optimistic projection, there is uncertainty. From its current level of around $2.72, XRP would need to rally more than 892% to reach $27. According to EGRAG, traders should lock in profits when possible.
XRP Lux Algo Premium Indicator However, he explained that in previous cycles, the Blue X sometimes misled traders into thinking a cycle top had arrived when it had not. Specifically, what typically happens is that the Blue X prints when XRP hits a top, followed by a corrective phase to form a local bottom. However, after this correction, a strong upward push toward the true cycle peak emerges, which historically forms without any Blue X appearing at the top. The chart covers XRP's entire price history from 2013 to 2025, separated into three main cycles. Cycle 1 ended around January 2018, while Cycle 2 concluded in April 2021, both topping out near the upper boundary of a long-term linear regression channel. For context, in the 2017/2018 cycle, XRP printed the Blue X when it hit $0.3988 in May 2017. However, after the correction, the true cycle top emerged at $3.3 in January 2018. Also, in the 2020/2021 cycle, XRP saw the Blue X when it soared to $0.79 in November 2020. However, after the pullback, it rose to the true cycle top of $1.96 in April 2021. XRP Blue X Prints in Previous Cycles | EGRAG Crypto XRP Regression Channel and Fib Targets According to EGRAG, each cycle top happened near the upper boundary of a long-term linear regression channel. Notably, this channel features a red median line at its center and blue lines at the top and bottom marking two standard deviations away from the median. During both prior cycles, XRP's price surged from the median line to the upper blue boundary before correcting sharply, creating the foundation for projecting the next cycle peak. In this cycle, XRP saw the Blue X after it reached the $3.4 peak in January 2025. Now, amid the recent correction, XRP trades above the red median line but remains far below the upper blue band, which the model now projects to be near $27 by Oct. 13, 2025. Current Cycle Top | EGRAG Crypto According to EGRAG, this aligns closely with Fibonacci extensions derived from both the 2017 and 2021 cycle peaks. The 2017 cycle top sits between the 1.618 and 1.88 Fibonacci levels at $20.46 and $49.44, while the 2021 peak aligns with the 2.414 and 2.618 levels at $23.49 and $34.08. The $27 target falls comfortably within both ranges. https://twitter.com/egragcrypto/status/1962073712468922450 Despite this optimistic projection, there is uncertainty. From its current level of around $2.72, XRP would need to rally more than 892% to reach $27. According to EGRAG, traders should lock in profits when possible.Market Opportunity
NEAR Price(NEAR)
$1.3635
$1.3635$1.3635
USD
NEAR (NEAR) Live Price Chart


Disclaimer: The articles reposted on this site are sourced from public platforms and are provided for informational purposes only. They do not necessarily reflect the views of MEXC. All rights remain with the original authors. If you believe any content infringes on third-party rights, please contact crypto.news@mexc.com for removal. MEXC makes no guarantees regarding the accuracy, completeness, or timeliness of the content and is not responsible for any actions taken based on the information provided. The content does not constitute financial, legal, or other professional advice, nor should it be considered a recommendation or endorsement by MEXC.
You May Also Like

Bitcoin Price Shoots to $72,000 After US-Iran Ceasefire, Is Bear Market Over?
Key Insights: The much-needed two-week ceasefire announcement in the US-Iran war has brought animal spirits back in the crypto market. Bitcoin price is up 4.38%
Share
Themarketperiodical2026/04/08 17:34

Argentine Banks Test JPMorgan’s JPM Coin for Faster Settlement Workflows
TLDR Argentine banks are reportedly testing JPMorgan’s JPM Coin for internal settlement workflows. Banco CMF is among the confirmed participants through its corporate
Share
Coincentral2026/04/08 17:26

BTC Chart Alert April 8: Approaches Major Downtrend Again – Rejection or Breakout Imminent?
Bitcoin has arrived at the point where it is knocking on the door of the 6-month + downtrend line. With some good news out of the Middle East, could Bitcoin ride
Share
Cryptodaily2026/04/08 17:38


