Bitcoin Price Eyes 80K as ETF Inflows Boost Market Demand and Short Squeeze
TLDR
- Bitcoin trades around 69000 while holding key 68000 support near 200 week EMA.
- US spot Bitcoin ETFs recorded 765 million dollars in two day inflows.
- Liquidation data shows 2 billion dollars in liquidity between 72450 and 75000.
- Break above 75000 may trigger short squeeze toward 80000 level.
Bitcoin is approaching a critical price zone as traders focus on the 80000 level amid rising ETF inflows and visible liquidation clusters. The cryptocurrency traded near 70000 during the New York session and held above key support levels.
At the time of writing, Bitcoin trades around 69000. Market participants are watching whether the price can maintain strength above 68000. Analysts link the current move to both technical factors and renewed institutional demand.
Bitcoin Holds Key Support Near $68000
Technical analysts point to the 200 week exponential moving average near 68000. A weekly close above this level could change the broader structure. Previous failures at this trendline led to renewed selling pressure.
Rekt Capital stated that Bitcoin is attempting to reclaim this average as support. A sustained hold above 68000 may support further upside. If price falls below this level, downside risks may return.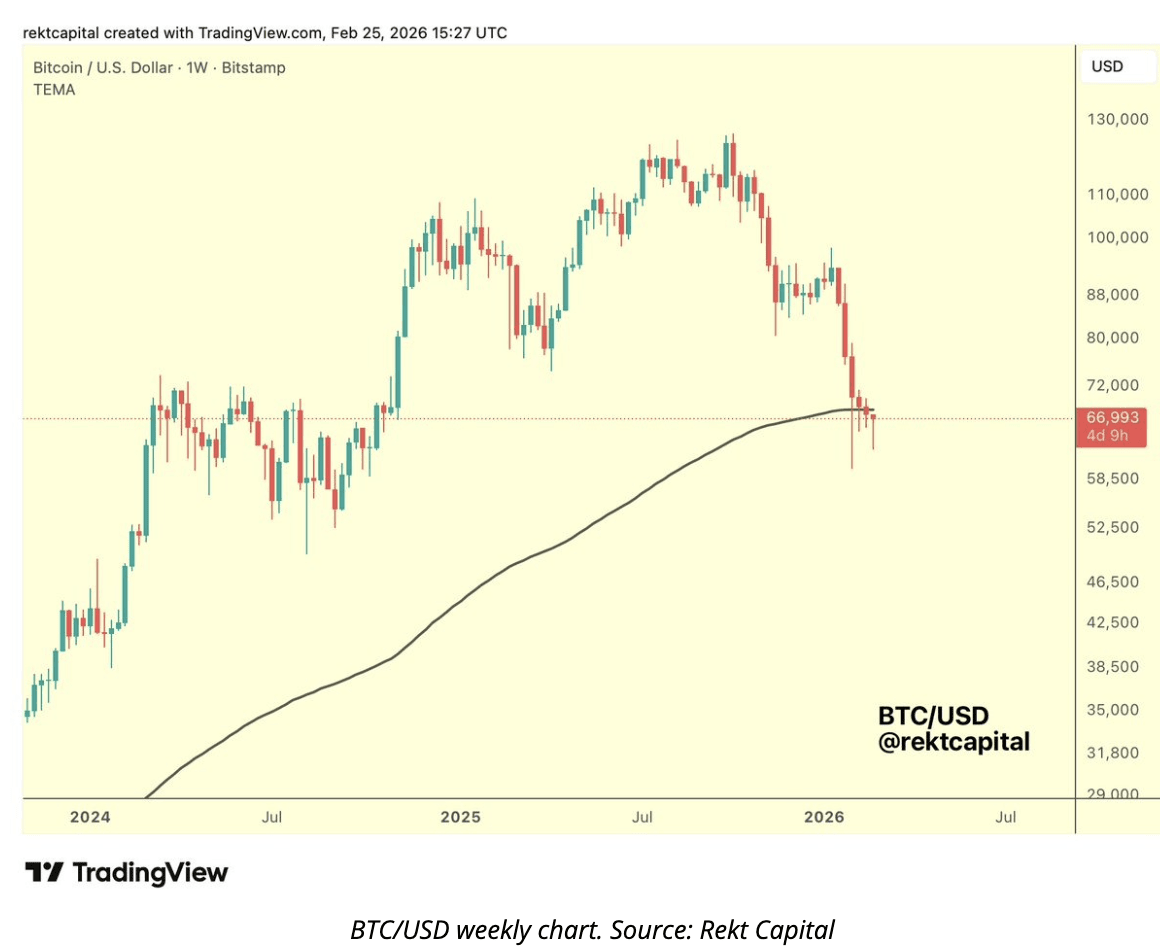
On lower time frames, traders monitor the 50 EMA on the four hour chart. This level also sits near 68000. Holding above it keeps short term momentum intact.
A move above the 20 day EMA near 69200 could open the path toward 74500. Sellers previously entered the market around that zone. A clear break may shift near term control to buyers.
Liquidation Clusters Point Toward 80000
Derivatives data shows large liquidity clusters above the current price. According to CoinGlass, around 2 billion dollars in ask liquidity sits between 72450 and 75000. This range may attract price movement.
If Bitcoin breaks above 75000, short positions could face forced liquidations. This process is known as a short squeeze. It can accelerate price movement in a short period.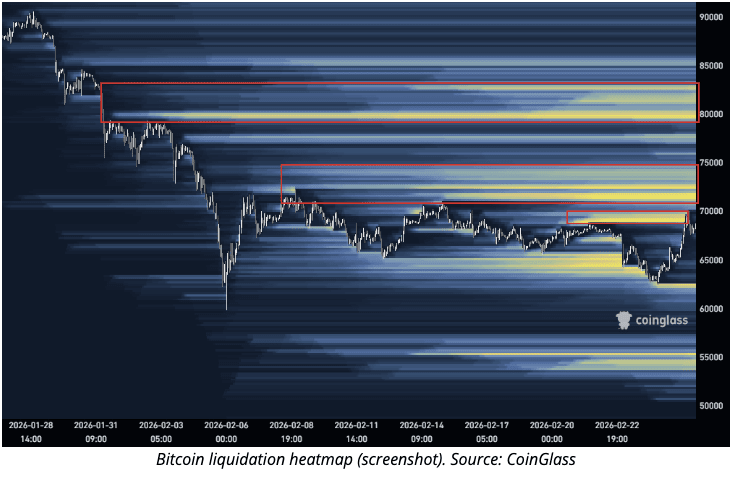
The next large liquidation cluster appears near 80000. Traders describe the current setup as a liquidity hunt. Price often moves toward areas with concentrated leverage and stop orders.
Market data shows that short positioning remains elevated. If resistance levels fail, covering activity may add upward pressure. However, failure to clear 75000 may slow momentum.
ETF Inflows Support Market Momentum
Institutional demand has returned through US spot Bitcoin ETFs. Data shows 258 million dollars in inflows on Tuesday. Wednesday recorded 507 million dollars in inflows.
The two day total reached 765 million dollars. The single day figure marked the strongest intake since early February. These flows suggest steady accumulation.
Analysts observe that ETF demand appears institutionally driven. The flows coincide with improving risk appetite in US equity markets. Bitcoin often moves in line with broader market sentiment.
Sustained inflows could reinforce technical breakouts. If ETF demand continues and support levels hold, traders may focus on higher liquidity zones. The 80000 level remains a key upside target.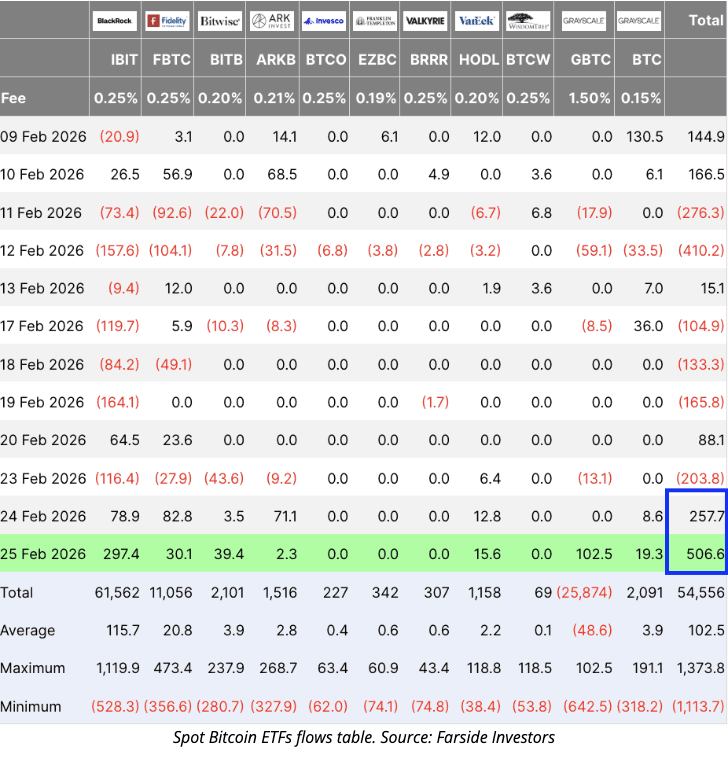
For now, the market watches several conditions. Bitcoin must hold 68000 support and clear resistance near 70000. A decisive move above 75000 may open the path toward 80000.
Failure to maintain support could shift focus back to lower levels. Price action in the coming sessions may determine whether the recovery extends further.
The post Bitcoin Price Eyes 80K as ETF Inflows Boost Market Demand and Short Squeeze appeared first on CoinCentral.
You May Also Like

“We Cannot in Good Conscience Agree”: Anthropic Defies Pentagon Over AI Weapons

Wormhole Unleashes W 2.0 Tokenomics for a Connected Blockchain Future