

Shiba Inu Price at Risk as Exchange Inflows Surge Past 531 Billion SHIB
Shiba Inu is entering the weekend under significant strain. On-chain data reveals that more than 531 billion SHIB tokens were transferred to exchanges within a single day. That figure is not routine. It signals a meaningful shift in market behavior, tilting conditions toward sellers rather than buyers.
Exchange inflows of this magnitude matter because tokens sent to trading platforms become immediately available for sale. When inflows spike sharply and without prior accumulation signals, the dominant interpretation is distribution, not positioning for growth. Traders appear to be preparing to offload holdings rather than build them.
Weekend sessions compound the risk. Cryptocurrency markets typically experience thinner liquidity on Saturdays and Sundays. Fewer active buyers mean that even moderate sell orders can generate outsized price movement. If the current inflow trend continues into the weekend, Shiba Inu's price could face sharper swings than the broader market might otherwise absorb.
At the time of writing, Shiba Inu trades at around $0.00000571, down 5.03% in the last 24 hours.
Technical Structure Remains Weak
SHIB's price action offers little encouragement. The token continues to trade below key moving averages, including the 26-period EMA and longer-term trend indicators. This positioning confirms that bearish momentum has not broken down. Buyers have not demonstrated the sustained conviction necessary to flip the trend.
Recent consolidation attempts have produced narrow trading ranges near local lows. Each stabilization effort has failed to generate meaningful upward follow-through. Volume during these brief recovery phases has remained well below levels seen during prior rallies. That contrast is important. Without volume, price recoveries lack structural credibility.
Short rebounds have emerged, but they have been consistently absorbed by sellers. No significant structural change has taken hold. The asset shows fatigue rather than preparation for a breakout. SHIB is compressing, not building momentum.
Inflow Data Points to Distribution, Not Accumulation
The on-chain inflow chart tells a clear story. Activity has pushed well above recent averages in a compressed timeframe. Movements of this scale, over half a trillion tokens in under 24 hours, do not typically reflect long-term holders increasing their conviction. They reflect repositioning ahead of potential exits.
Distribution phases often look calm on the surface. Prices may hold relatively stable while large quantities of tokens quietly migrate to exchanges. The stability is deceptive. It reflects a temporary balance between supply arriving on exchanges and residual buying demand absorbing it. When that demand fades, prices drop.


You May Also Like

StakeStone (STO) Rockets 125%: What $981M Trading Volume Reveals
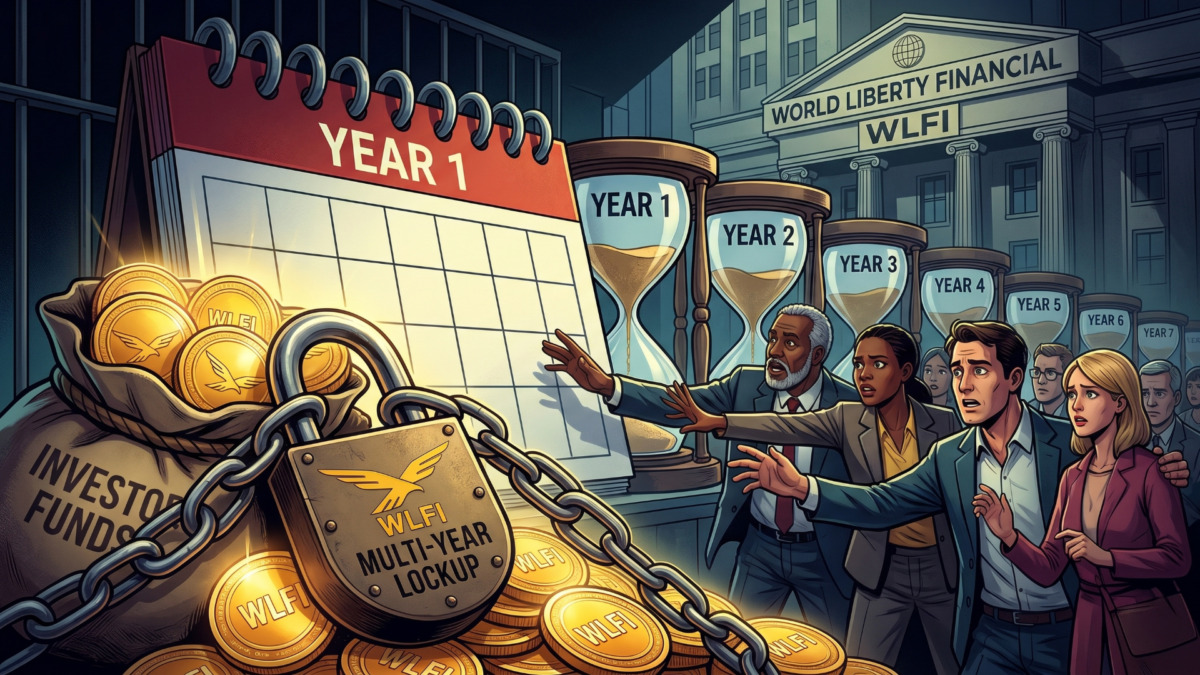
Trump-Linked Crypto Locks Investors Into Multi-Year Wait for Token Access


