

Dogecoin (DOGE) Price: $0.211 Level Emerges as Critical Decision Point for Next Market Move
TLDR
- Dogecoin is currently trading around $0.21, near its 200-day EMA, which serves as a critical support level
- DOGE is forming a triangular pattern similar to those that preceded previous major rallies in 2016 and 2020
- Derivatives data shows negative funding rates and increasing short positions, suggesting bearish sentiment
- Whale addresses have offloaded approximately 250 million DOGE tokens since August 25
- Key resistance levels sit at $0.253 and $0.370, while support levels are at $0.214 and $0.185
Dogecoin (DOGE) is currently at a crossroads, trading around $0.21 as of Tuesday, September 2, 2025. The original meme cryptocurrency is showing mixed signals that have caught the attention of traders and analysts alike.
The price is hovering near its 200-day Exponential Moving Average (EMA) of $0.211, which represents a crucial level that could determine the next directional move for DOGE.
Chart analysis reveals that Dogecoin has formed a triangular pattern that bears striking resemblance to formations observed before major rallies in 2016 and 2020. During those periods, DOGE traded sideways for months within a tightening triangle before experiencing explosive upward movements.
Analyst @galaxyBTC has highlighted this setup, noting how DOGE is pushing against a descending resistance line while maintaining position above an ascending support trend. This pattern has historically preceded major price movements for the cryptocurrency.
For traders watching the markets closely, key support levels include $0.214, with stronger backing near $0.185. On the upside, resistance can be found at $0.253 and $0.370.
Market Indicators Turn Bearish
Despite the promising chart pattern, several market indicators suggest growing bearish sentiment around Dogecoin.
Data from CoinGlass shows that the OI-Weighted Funding Rate has turned negative, reading -0.0010%. This indicates that traders holding short positions are paying those with long positions, a sign that more market participants are betting on price decreases than increases.
Historically, when funding rates have flipped from positive to negative, DOGE’s price has experienced downward pressure. The long-to-short ratio for Dogecoin also supports this bearish outlook, as short bets are rising among traders.
On-chain metrics from Santiment paint a similar picture. Supply Distribution data shows that whale addresses holding between 100,000 and 100 million DOGE tokens have reduced their holdings by approximately 250 million DOGE since August 25.
This selling pressure from larger holders could contribute to further downside if it continues. The offloading of tokens by these significant stakeholders often precedes price drops in the cryptocurrency market.
Technical Analysis Points to Critical Decision Point
From a technical analysis perspective, Dogecoin was rejected from its previously broken ascending trendline on Sunday, resulting in a nearly 3% decline the following day.
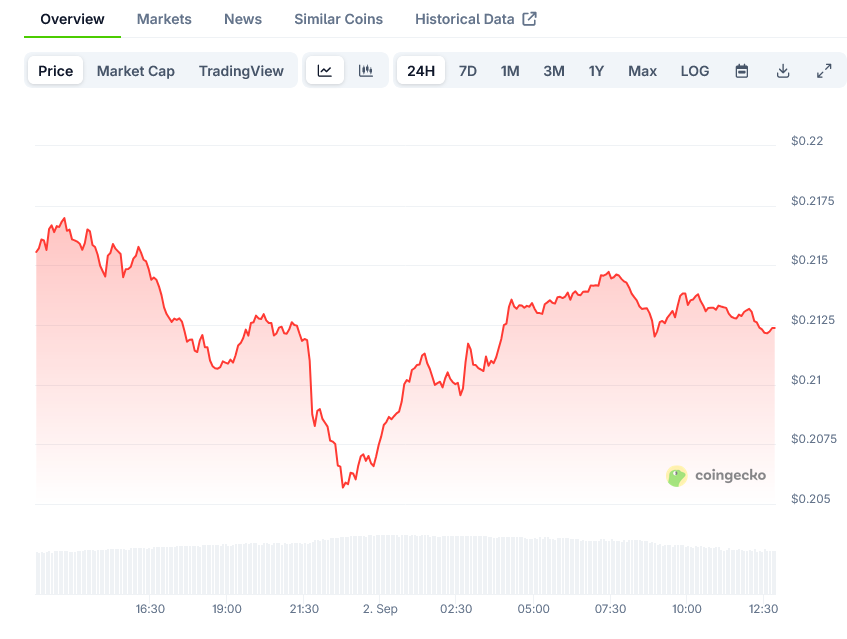 Dogecoin Price on CoinGecko
The Relative Strength Index (RSI) on the daily chart reads 46, remaining below its neutral level of 50, which suggests bearish momentum. The Moving Average Convergence Divergence (MACD) continues to display a bearish crossover, further reinforcing the negative outlook.
If DOGE closes below the $0.211 level on a daily basis, it could extend its correction to retest weekly support at $0.181. However, if the 200-day EMA holds as support, DOGE could recover toward its daily resistance level at $0.247.
The community behind Dogecoin remains active, with retail traders still showing enthusiasm for the original meme coin. This continued support could prove valuable if market sentiment shifts.
Dogecoin’s price remains at $0.21439 as it tests the critical 200-day EMA level, with traders closely watching for a decisive move that could determine its trajectory in the coming weeks.
The post Dogecoin (DOGE) Price: $0.211 Level Emerges as Critical Decision Point for Next Market Move appeared first on Blockonomi.


You May Also Like

Semidynamics Secures a Strategic Investment to Advance Memory-Centric AI Inference Chips

SEC Enforcement Drops Sharply in 2025 as New Leadership Shifts Agency Focus


