The post Bitcoin Near Key Resistance: Fifth Wave Risk Ahead appeared on BitcoinEthereumNews.com. Bitcoin trades at $66827 near $68500 resistance with 507M ETF inflowsThe post Bitcoin Near Key Resistance: Fifth Wave Risk Ahead appeared on BitcoinEthereumNews.com. Bitcoin trades at $66827 near $68500 resistance with 507M ETF inflows

Bitcoin Near Key Resistance: Fifth Wave Risk Ahead

Bitcoin trades at $66827 near $68500 resistance with 507M ETF inflows as traders monitor 60000 support and fifth wave risk.

Bitcoin is testing a critical resistance zone after stabilizing above multiweek support. Traders are assessing whether the move signals continuation or another leg lower.

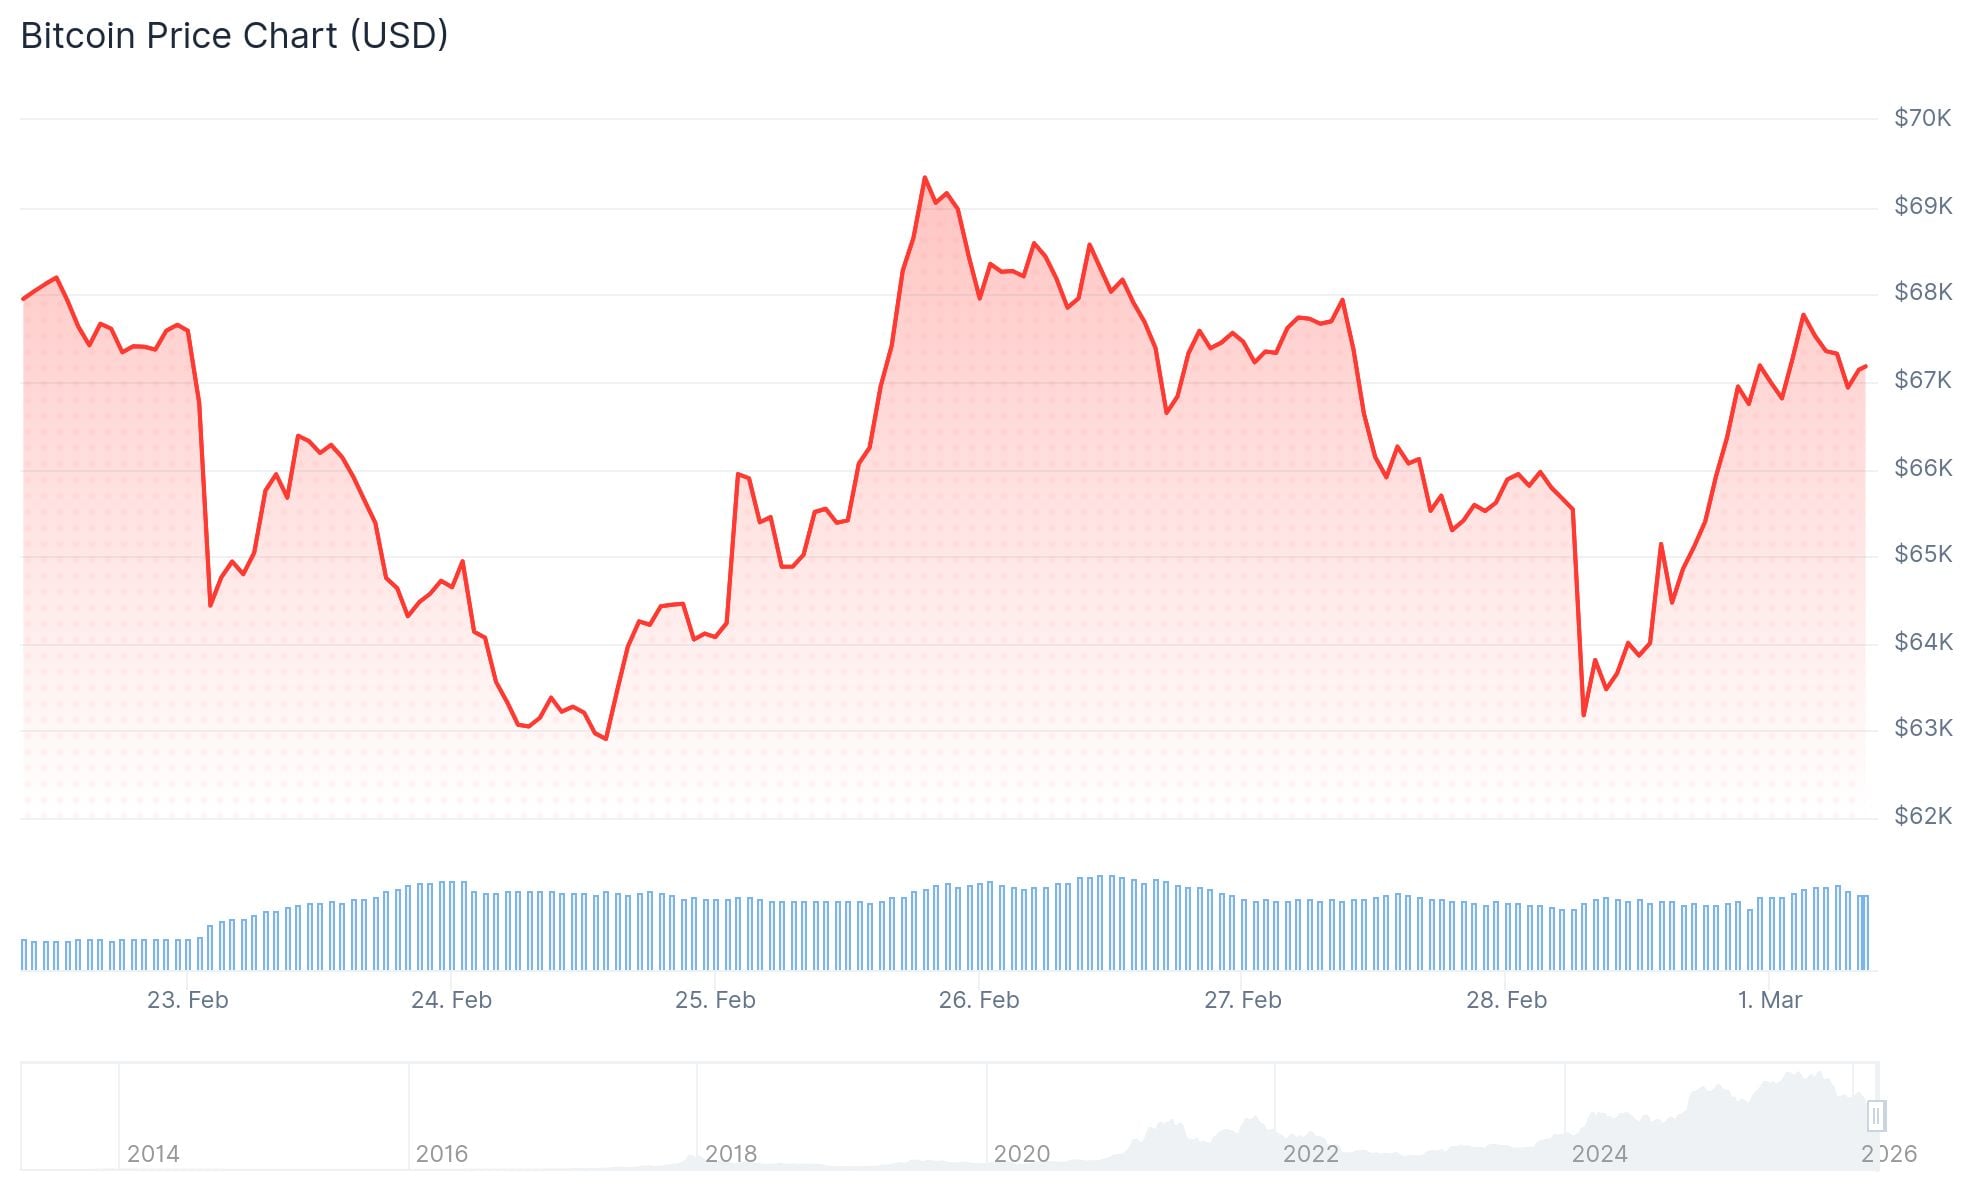
At the time of writing, Bitcoin was trading at $66,827. The cryptocurrency has rebounded from levels near $63,000.

However, price remains inside a broader sideways structure. Market participants are watching resistance levels and lower time frame patterns for direction.

Price Structure Remains Range Bound

Bitcoin continues to hold above $62,594, which has acted as support for three weeks. As long as this level holds, the wider range remains valid.

No confirmed breakout has occurred. The immediate resistance zone stands between $65,609 and $68,457.

Price is pressing toward the $68,500 area, which aligns with the 100 period EMA on the four hour chart. This level is acting as a technical barrier.

A sustained move above $70,600 could open the path toward $72,271. The $72,000 to $75,000 range serves as a broader ceiling.

As long as Bitcoin trades below $75,000, the larger structure remains capped. Technical indicators show moderate strength.

The relative strength index stands near 60, and it reflects positive momentum. 

The MACD line remains above the signal line, and the histogram shows steady upside pressure.

Bitcoin also trades above the 50 period EMA near $66,900. This positioning supports near term stability.

However, expansion remains limited while price stays below the 100 period EMA.

Micro Structure and Fifth Wave Scenario

Short term charts show small impulsive moves within the range. Analysts note that sideways markets often invalidate lower time frame setups.

Corrective conditions tend to produce overlapping price action. Traders are watching for a clear five wave decline on lower time frames.

If such a structure forms, it could increase the probability of a larger fifth wave lower. Degree and time frame context remain critical.

A five wave move on a 15 minute chart does not confirm a broader trend change. Higher time frame direction remains dominant.

In range conditions, smaller impulses often retrace quickly. If Bitcoin breaks below $60,000, selling pressure could increase.

Market analysis points to $57,500 as a potential downside level. A deeper move toward $52,000 remains possible if weakness expands.

Analysts state that stability above $60,000 keeps the rebound scenario active. Buyers may respond at this psychological level. A breakdown would shift focus toward downside continuation.

Related Reading: Why Bitcoin’s $100K “Resistance” Is Artificial, Not Technical

ETF Inflows and Broader Developments

Spot Bitcoin ETFs have recorded inflows of approximately $507 million. This data reflects ongoing institutional and retail participation.

Ethereum spot ETFs added $157 million, while XRP products recorded $3.09 million. These inflows coincide with Bitcoin holding above key moving averages. 

Market participants are monitoring volume and momentum closely. Resistance near $68,500 remains a near term test.

Policy developments are also drawing attention. Missouri lawmakers advanced legislation to create a state run Bitcoin Strategic Reserve Fund.

The proposal mandates a five year holding period and cold storage for donated Bitcoin.

The next sessions may determine whether Bitcoin clears resistance or forms a lower high.

A confirmed move above $71,600 could reduce immediate downside risk. Failure to break higher may renew focus on the potential fifth wave drop scenario.

Source: https://www.livebitcoinnews.com/bitcoin-tests-key-resistance-is-a-fifth-wave-drop-coming/

Market Opportunity
NEAR Logo
NEAR Price(NEAR)
$1.164
$1.164$1.164
+9.11%
USD
NEAR (NEAR) Live Price Chart
Disclaimer: The articles reposted on this site are sourced from public platforms and are provided for informational purposes only. They do not necessarily reflect the views of MEXC. All rights remain with the original authors. If you believe any content infringes on third-party rights, please contact crypto.news@mexc.com for removal. MEXC makes no guarantees regarding the accuracy, completeness, or timeliness of the content and is not responsible for any actions taken based on the information provided. The content does not constitute financial, legal, or other professional advice, nor should it be considered a recommendation or endorsement by MEXC.

You May Also Like

Top 5 Cryptocurrencies for Long-Term Investment in 2026: Expert Analysis

Top 5 Cryptocurrencies for Long-Term Investment in 2026: Expert Analysis

Discover the top 5 cryptocurrencies for long-term investment in 2026. Bitcoin, Ethereum, Solana, Chainlink, and Avalanche lead with institutional backing. The post
Share
Blockonomi2026/03/01 19:48
Tindig Pilipinas backs clergy’s complaint to fast-track Sara Duterte impeachment

Tindig Pilipinas backs clergy’s complaint to fast-track Sara Duterte impeachment

'Consolidating our support behind the third complaint will strengthen our position and help move the case forward to the Senate impeachment court,' Tindig Pilipinas
Share
Rappler2026/03/01 19:47
3 Paradoxes of Altcoin Season in September

3 Paradoxes of Altcoin Season in September

The post 3 Paradoxes of Altcoin Season in September appeared on BitcoinEthereumNews.com. Analyses and data indicate that the crypto market is experiencing its most active altcoin season since early 2025, with many altcoins outperforming Bitcoin. However, behind this excitement lies a paradox. Most retail investors remain uneasy as their portfolios show little to no profit. This article outlines the main reasons behind this situation. Altcoin Market Cap Rises but Dominance Shrinks Sponsored TradingView data shows that the TOTAL3 market cap (excluding BTC and ETH) reached a new high of over $1.1 trillion in September. Yet the share of OTHERS (excluding the top 10) has declined since 2022, now standing at just 8%. OTHERS Dominance And TOTAL3 Capitalization. Source: TradingView. In past cycles, such as 2017 and 2021, TOTAL3 and OTHERS.D rose together. That trend reflected capital flowing not only into large-cap altcoins but also into mid-cap and low-cap ones. The current divergence shows that capital is concentrated in stablecoins and a handful of top-10 altcoins such as SOL, XRP, BNB, DOG, HYPE, and LINK. Smaller altcoins receive far less liquidity, making it hard for their prices to return to levels where investors previously bought. This creates a situation where only a few win while most face losses. Retail investors also tend to diversify across many coins instead of adding size to top altcoins. That explains why many portfolios remain stagnant despite a broader market rally. Sponsored “Position sizing is everything. Many people hold 25–30 tokens at once. A 100x on a token that makes up only 1% of your portfolio won’t meaningfully change your life. It’s better to make a few high-conviction bets than to overdiversify,” analyst The DeFi Investor said. Altcoin Index Surges but Investor Sentiment Remains Cautious The Altcoin Season Index from Blockchain Center now stands at 80 points. This indicates that over 80% of the top 50 altcoins outperformed…
Share
BitcoinEthereumNews2025/09/18 01:43