Injective (INJ) Price Drops 95% – This Same Setup Once Delivered a 4,619% Explosion
The INJ price is sitting at a make-or-break level. After dropping roughly 95% from its macro high, Injective has now retraced almost the same percentage as it did before its last massive run, the one that delivered a 4,619% rally. That kind of symmetry doesn’t go unnoticed.
Prominent analyst, Crypto Patel believes the INJ price isn’t in freefall anymore. In his view, it’s compressing inside a high-timeframe fair value gap, potentially forming a multi-year re-accumulation base.
The key line in the sand sits at $1.10. Stay above it on a high-timeframe close, and the structure remains intact. Lose it, and the bullish case falls apart. So the big question becomes: is this the next generational base, or the final leg down?
INJ Macro Structure: From Euphoria to Reset
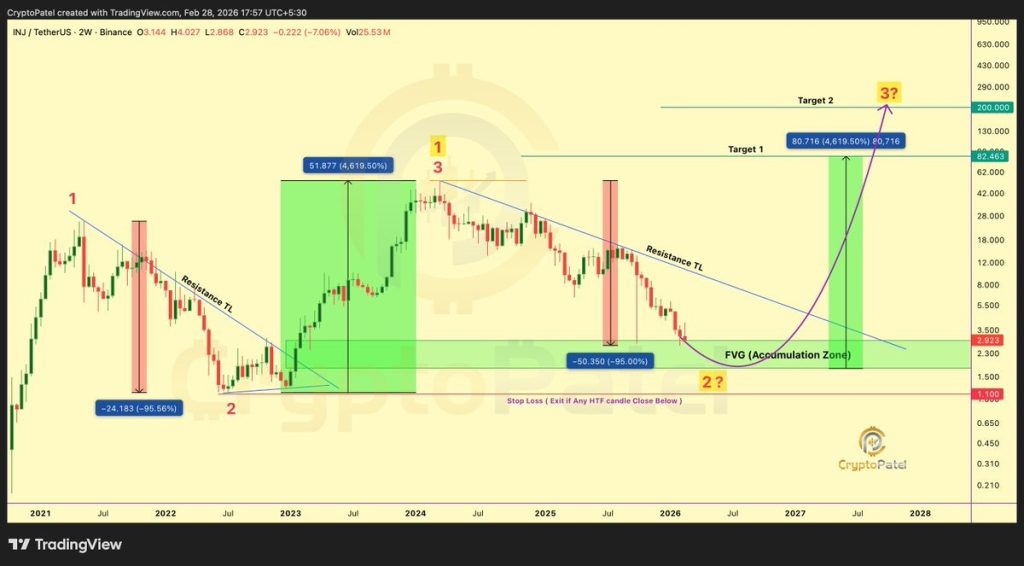
Looking at the two-week chart shared by Patel, the cycle structure is easy to follow. The INJ price completed a powerful impulsive move into its 2024 high, climbing in near-parabolic fashion. That marked the peak. From there, price rolled over into a prolonged corrective phase.
That correction has now reached about −95% from the top. Interestingly, that mirrors the previous deep pullback that came right before the 4,600% expansion. The chart even measures both moves side by side, showing how similar they are in magnitude.
 Source: X/@CryptoPatel
Right now, the INJ price is sitting inside a high-timeframe imbalance zone between roughly $2.70 and $1.70. This area is acting as demand. Price is carving out what looks like a rounded base, all while compressing beneath a multi-year descending resistance trendline.
And that compression is important. Historically, the pattern has looked like this: strong impulse, deep reset, tight consolidation, then breakout. The INJ price appears to be in that consolidation phase.
The Critical INJ Price Level: $1.10
Risk management on this chart is straightforward. A high-timeframe close below $1.10 invalidates the accumulation thesis. That level marks the deeper demand boundary.
As long as the INJ price holds above $1.10, the structure stays constructive. A break below would likely open the door to lower liquidity and confirm structural weakness.
If the bullish scenario plays out, upside targets expand quickly. The first major macro level sits around $80, echoing prior expansion symmetry. Beyond that, $200 becomes a long-range projection if a full cycle breakout develops.
Compression Before Expansion?
One of the strongest elements in this setup is volatility contraction. The INJ price is coiling tighter beneath descending resistance, forming a narrowing structure inside demand. Moves like that often precede large directional expansions.
The previous +4,619% rally began after a similar rounded base formed inside deep demand. Once resistance broke, price accelerated rapidly.
Today’s structure carries similar characteristics: a completed deep correction, basing action inside imbalance, and pressure building under long-term resistance.
Still, confirmation hasn’t arrived yet. The breakout requires reclaiming and closing above that descending trendline. Until then, accumulation remains a possibility, not a certainty.
Read Also: Strait of Hormuz Freeze: Oil Tankers Turn Back as War Risk Insurance Vanishes Overnight
What Comes Next for INJ
The INJ price is at a crossroads. A 95% correction has cleared excess speculation and pushed price back into historical demand territory. The risk level is clearly defined at $1.10.
If that support holds and compression resolves upward, $80 and even $200 come into focus over time. If it fails, the structure breaks. Right now, the chart shows symmetry, tightening volatility, and clearly defined risk. Whether history repeats will depend on what happens next inside this accumulation zone.
Subscribe to our YouTube channel for daily crypto updates, market insights, and expert analysis.
The post Injective (INJ) Price Drops 95% – This Same Setup Once Delivered a 4,619% Explosion appeared first on CaptainAltcoin.


You May Also Like

Using silence in executive headhunting
Veteran diplomats stick a knife in Kushner and Witkoff negotiations: 'They get an F'