

Bitcoin Prints A 2022-Like Iran War Chart, But It’s Not
Renowned macro analyst Alex Krüger is pushing back on a comparison that has taken hold across desks since strikes involving Iran began: that markets are replaying the 2022 Russia-Ukraine shock, with crypto and Bitcoin in particular tracing an uncomfortably familiar pattern.
Yes, the setups rhyme, Krüger wrote in a March 4 Substack note. But he argues the analogy breaks where it matters for Bitcoin: monetary policy and the persistence of the energy shock. “Markets are panicking. Everyone sees 2022 again. The chart setups look almost identical and the energy shock is real,” he wrote. “But the comparison falls apart under scrutiny. The macro is different, and the oil disruption is transitory.”
What Is Crucial For Bitcoin Now
Krüger’s starting point is historical rather than crypto-specific: wars and kinetic conflicts have often created “buying opportunities,” even when the initial impulse is risk-off. The reason 2022 became so toxic for risk, he says, wasn’t the invasion itself, it was what came after.
In 2022, Bitcoin and overall risk assets bottomed on the day Russia invaded Ukraine (Feb. 24), then bounced hard, then rolled over by late March as markets resumed sliding. The war was the catalyst, not the engine. The engine was a Federal Reserve forced into an aggressive hiking cycle with inflation already running hot, and an oil spike that worsened the inflation problem.
Krüger’s core claim is that 2026 does not have the same policy backdrop. In 2022, the Fed was “behind the curve” with year-over-year inflation at 7.9% and the real Fed Funds rate around -7.5% when war broke out. Today, he says the Fed is in “wait-and-see mode,” with inflation trending lower and real rates around +1.2%.
He frames the policy asymmetry in blunt terms: “Even if the oil spike pushes headline inflation temporarily higher, the Fed has room to look through it. At +1.2% real rates, they don’t need to tighten into a supply shock. In 2022 they had no choice — at -7.5% they were catastrophically behind. That’s the difference that matters for risk assets.”
Krüger points to recent Fed communication as consistent with that stance. John Williams said oil would affect the “near-term inflation outlook” but that persistence mattered: “code for: we’re not moving unless this lasts,” Krüger wrote, while noting the US is less oil-dependent than past decades.
Treasury Secretary Scott Bessent also argued the US is “in a very different position than when Russia invaded Ukraine.” Since the strikes began, Krüger noted, four Fed officials have spoken publicly without changing their outlook; Williams described the market reaction as “muted,” Neel Kashkari said it’s “too soon to know” and still sees one to two cuts this year if inflation cools, and hawk Beth Hammack called policy “neutral” while urging an extended pause.
The second pillar of Krüger’s argument is that the oil disruption in 2026 is more likely to be temporary than the structural break of 2022. Then, Europe lost access to roughly 4.5 million barrels per day of Russian crude and refined products and sanctions made that disruption effectively permanent; Brent surged near $130 on March 8 and didn’t sustainably break below $90 until late August.
This time, he argues, Iran’s own barrels are not the key variable. Iran produced roughly 3.3 million bpd and exported about 1.9 million bpd before the strikes, mostly to China through shadow channels at an $11–$12 discount to Brent, with most of its tanker fleet already sanctioned, meaning “additional sanctions on Iran post-war would change nothing.”
The market’s focus, instead, is the Strait of Hormuz, where roughly 14 million bpd transits — about 20% of global petroleum liquids consumption and where traffic has “dropped almost to a standstill.”
Krüger says the futures curve is doing the real talking. In 2022, the front month repriced about +50% and the tenth contract +29%, signaling a long repair job. In 2026, he estimates the front month is up +32% but the tenth contract only +12%, “despite a shock affecting 4.4x more barrels,” implying traders see an expiration date to the disruption rather than a rewiring of supply chains.
Tail Risk Is The Curve’s “Tell”
Krüger is explicit about what could turn a “transitory” shock into a 2022-style regime shift: direct, repeated hits that take refining capacity or LNG offline for months. Iran has already struck Ras Tanura, Fujairah, and Qatari LNG facilities, he wrote, mostly with debris from intercepted drones but he sees an escalation pattern toward energy infrastructure, with “tens of thousands of drones in reserve.”
“If direct hits start landing on refining capacity — SAMREF, Jebel Ali, Jubail — that is lost production that does not come back with a ceasefire. Refineries take months to repair,” he wrote. “And the risk is no longer limited to oil. This is becoming a products and gas crisis, not just a crude problem.” Krüger added that QatarEnergy has shut down LNG output at Ras Laffan and Mesaieed, removing roughly a fifth of global LNG export capacity.
For Bitcoin, the takeaway is less about pattern-matching the chart and more about watching whether the macro “off-switch” remains credible. Krüger’s rule of thumb is simple: if the back end of the curve starts repricing, for example, if that tenth contract moves from roughly +12% toward +25%, the market is signaling the shock is turning structural. “But as of today,” he wrote, “the curve hasn’t blinked. Don’t confuse a transitory geopolitical shock (2026) with a major liquidity crisis (2022).”
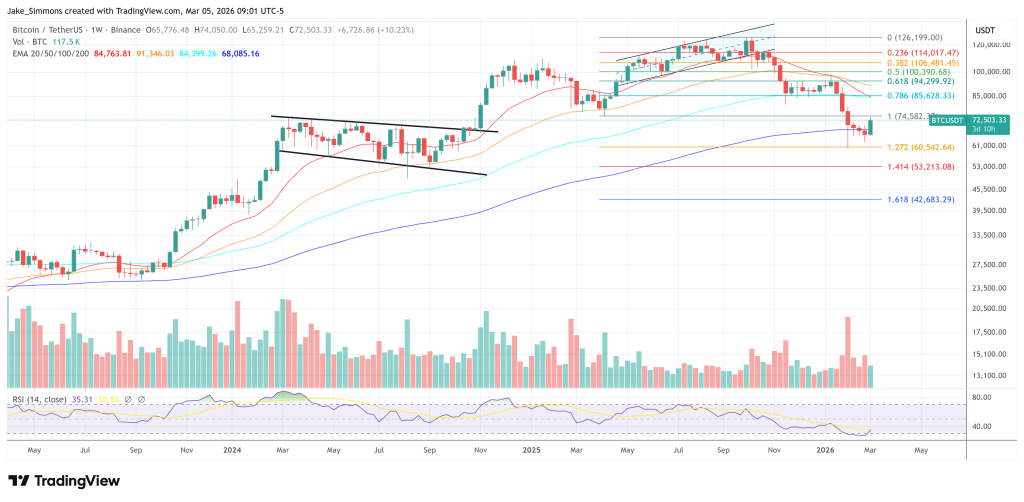
At press time, Bitcoin traded at $


You May Also Like

The Champion Mindset: Why Discipline, Trust, and Structure Matter in Modern Trading

Temu Owner PDD (PDD) Stock Drops After Profit Comes in Way Below Estimates
XRP Faces Further Downside Risk as Liquidity Drops to 2020 Lows, Sentiment Turns Fearful


