TLDR XRP is trading around $1.34, roughly 64% below its all-time high of $3.84 set in January 2018. On-chain data shows 36.8 billion XRP tokens are currently heldTLDR XRP is trading around $1.34, roughly 64% below its all-time high of $3.84 set in January 2018. On-chain data shows 36.8 billion XRP tokens are currently held

XRP Price: What the $51 Billion in Unrealized Losses Means for Holders Right Now

2026/03/09 15:47
3 min read
For feedback or concerns regarding this content, please contact us at crypto.news@mexc.com

TLDR

  • XRP is trading around $1.34, roughly 64% below its all-time high of $3.84 set in January 2018.
  • On-chain data shows 36.8 billion XRP tokens are currently held at a loss, totaling $50.8 billion in unrealized losses.
  • Key support sits at $1.33; a break below could push the price toward $1.25.
  • MACD and Chaikin Money Flow indicators both point to short-term bearish momentum.
  • If Bitcoin drops below $60,000, analysts flag $0.85–$0.95 as the next major XRP support zone.

XRP is under pressure this week, trading near $1.34 after failing to hold key support levels. The token has now shed nearly two-thirds of its value from its all-time high.
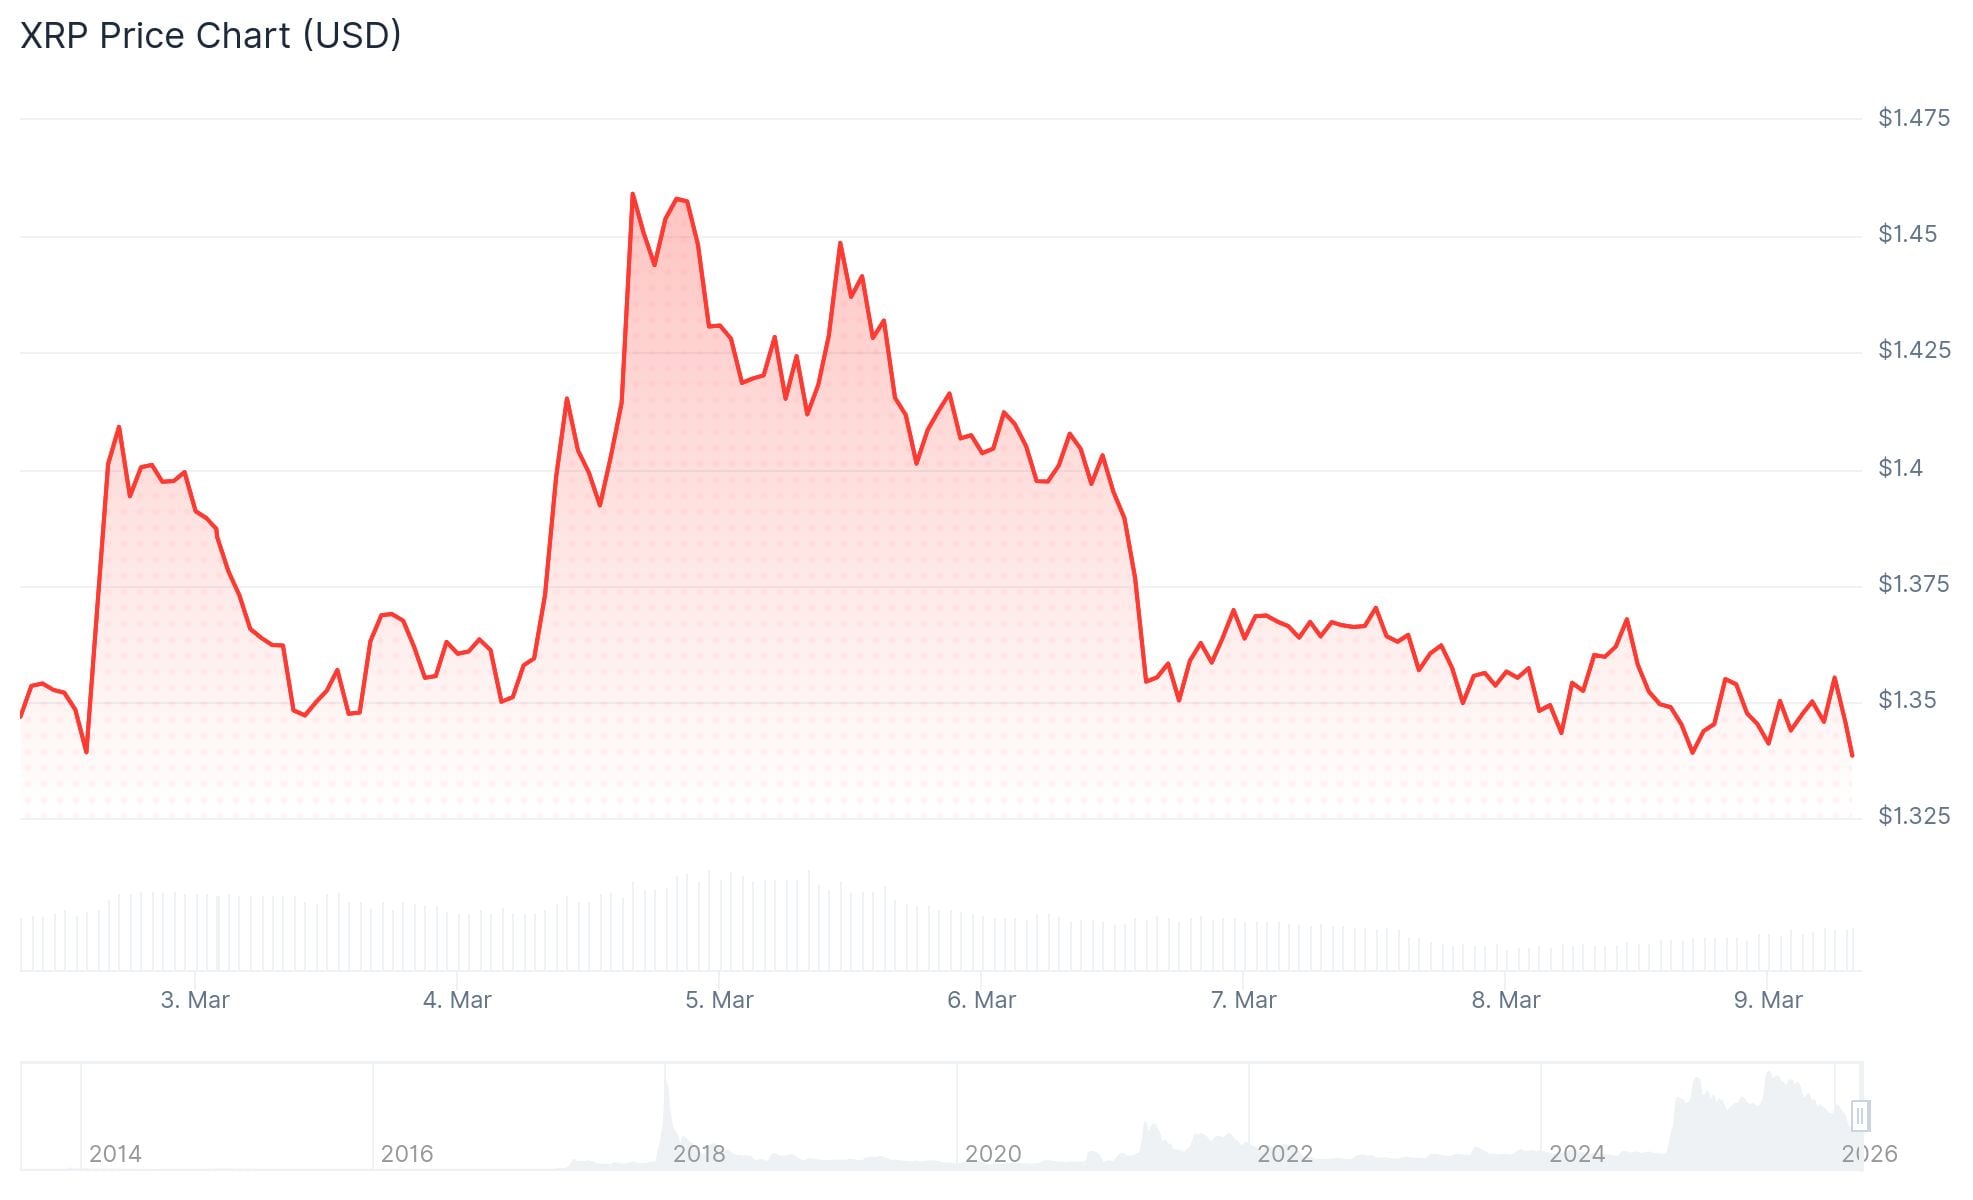
xrp priceXRP Price

On-chain data from Glassnode shows that 36.8 billion XRP tokens are currently underwater. That figure translates to approximately $50.8 billion in unrealized losses across the XRP network.

XRP hit its record high of $3.84 in January 2018. The current price puts the token roughly 64% below that level.

Throughout 2025, XRP ran hard. The token crossed $1, $2, and eventually broke $3, bringing nearly every token in circulation into profit. That picture has since reversed sharply.

After a brief recovery in January 2026, XRP faced heavy selling pressure again in February. Since then, the price has failed to post any meaningful recovery and has drifted toward the lower end of its current range.

Technical Levels to Watch

XRP is currently trading below both the $1.3550 price level and the 100-hour simple moving average. A bearish trend line has formed on the hourly chart, with resistance sitting around $1.3520.

The MACD indicator is sitting just below the zero line, signaling weak buying momentum. The Chaikin Money Flow reading of around -0.27 shows ongoing capital outflows, adding to the bearish short-term picture.

The first resistance level to watch on the upside is $1.38. A move above that could push XRP toward $1.40 and potentially $1.50. On the downside, a break below $1.33 support opens the door to $1.30 and lower.

Broader Market Context

The total crypto market cap fell 1.19% to $2.3 trillion in 24 hours. Bitcoin dropped 1.12% to $67,166 during the same period. Spot Bitcoin ETFs logged over $348 million in outflows earlier in the week.

One analyst noted that if Bitcoin falls below $60,000, XRP could test the $0.85–$0.95 range. A deeper drop to $0.56–$0.66 would, in their view, represent full market capitulation.

The current level of unprofitable supply is approaching thresholds seen during previous bear markets, according to Glassnode data.

XRP last changed hands at $1.34, per CoinGecko.

The post XRP Price: What the $51 Billion in Unrealized Losses Means for Holders Right Now appeared first on CoinCentral.

Market Opportunity
XRP Logo
XRP Price(XRP)
$1.3572
$1.3572$1.3572
+0.82%
USD
XRP (XRP) Live Price Chart
Disclaimer: The articles reposted on this site are sourced from public platforms and are provided for informational purposes only. They do not necessarily reflect the views of MEXC. All rights remain with the original authors. If you believe any content infringes on third-party rights, please contact crypto.news@mexc.com for removal. MEXC makes no guarantees regarding the accuracy, completeness, or timeliness of the content and is not responsible for any actions taken based on the information provided. The content does not constitute financial, legal, or other professional advice, nor should it be considered a recommendation or endorsement by MEXC.

You May Also Like

Litecoin Fluctuates Below The $116 Threshold

Litecoin Fluctuates Below The $116 Threshold

The post Litecoin Fluctuates Below The $116 Threshold appeared on BitcoinEthereumNews.com. Sep 17, 2025 at 23:05 // Price Litecoin price analysis by Coinidol.com: LTC price has slipped below the moving average lines after hitting resistance at $120. Litecoin price long-term prediction: bearish The 21-day SMA support helped to alleviate the selling pressure. In other words, the price of the cryptocurrency is above the 21-day SMA support but below the 50-day SMA barrier. This suggests that Litecoin will be trapped in a narrow range for a few days. If the 21-day SMA support or the 50-day SMA barrier is overreached, the cryptocurrency will trend upwards. For example, if the LTC price breaks through the 50-day SMA barrier, it will rise to a high of $124. Litecoin will fall to its current support level of $106 if the 21-day SMA support is broken. Technical Indicators  Resistance Levels: $100, $120, $140 Support Levels: $60, $40, $20 LTC price indicators analysis Litecoin’s price is squeezed between the moving average lines. It is unclear in which direction Litecoin will move. The moving average lines are horizontal in both charts. However, the price bars are limited to the distance between the moving averages. The price bars on the 4-hour chart are below the moving average lines. LTC/USD price chart – September 17, 2025 What is the next move for LTC? On the 4-hour chart, Litecoin is currently trading in a bearish trend zone. The altcoin is trading above the $112 support and below the moving average lines, which represent resistance at $116. The upward movement is hindered by the moving average lines, which are causing the price to oscillate within a limited range. Meanwhile, the signal for the cryptocurrency is bearish, with price bars below the moving average…
Share
BitcoinEthereumNews2025/09/18 08:15
XRP Price Watch: Price Action Tightens in Micro Range as Bulls Seek Control

XRP Price Watch: Price Action Tightens in Micro Range as Bulls Seek Control

The post XRP Price Watch: Price Action Tightens in Micro Range as Bulls Seek Control appeared on BitcoinEthereumNews.com. On Sunday, XRP is trading at $2.99 with a market capitalization of $178 billion and a 24-hour trading volume of $3.34 billion. The intraday price range sits narrowly between $2.97 and $3.01, suggesting a temporary equilibrium between buyers and sellers. XRP The 1-hour chart reflects a period of choppy, range-bound trading, typical of market indecision. […] Source: https://news.bitcoin.com/xrp-price-watch-price-action-tightens-in-micro-range-as-bulls-seek-control/
Share
BitcoinEthereumNews2025/09/21 22:41
River Token Plunges 20.8% in 24 Hours: On-Chain Data Reveals Pressure Points

River Token Plunges 20.8% in 24 Hours: On-Chain Data Reveals Pressure Points

River (RIVER) experienced a sharp 20.8% decline to $12.35 within 24 hours, erasing $64 million in market capitalization. Our data analysis reveals concerning volume
Share
Blockchainmagazine2026/03/09 18:04