XRP trades at $1.34 with $50.8B in unrealized losses. Analyzing key support levels, technical indicators, and what's next for XRP holders. The post XRP (XRP) PriceXRP trades at $1.34 with $50.8B in unrealized losses. Analyzing key support levels, technical indicators, and what's next for XRP holders. The post XRP (XRP) Price

XRP (XRP) Price: Unpacking the Massive $51B in Unrealized Losses for Token Holders

2026/03/09 16:02
3 min read
For feedback or concerns regarding this content, please contact us at crypto.news@mexc.com

TLDR

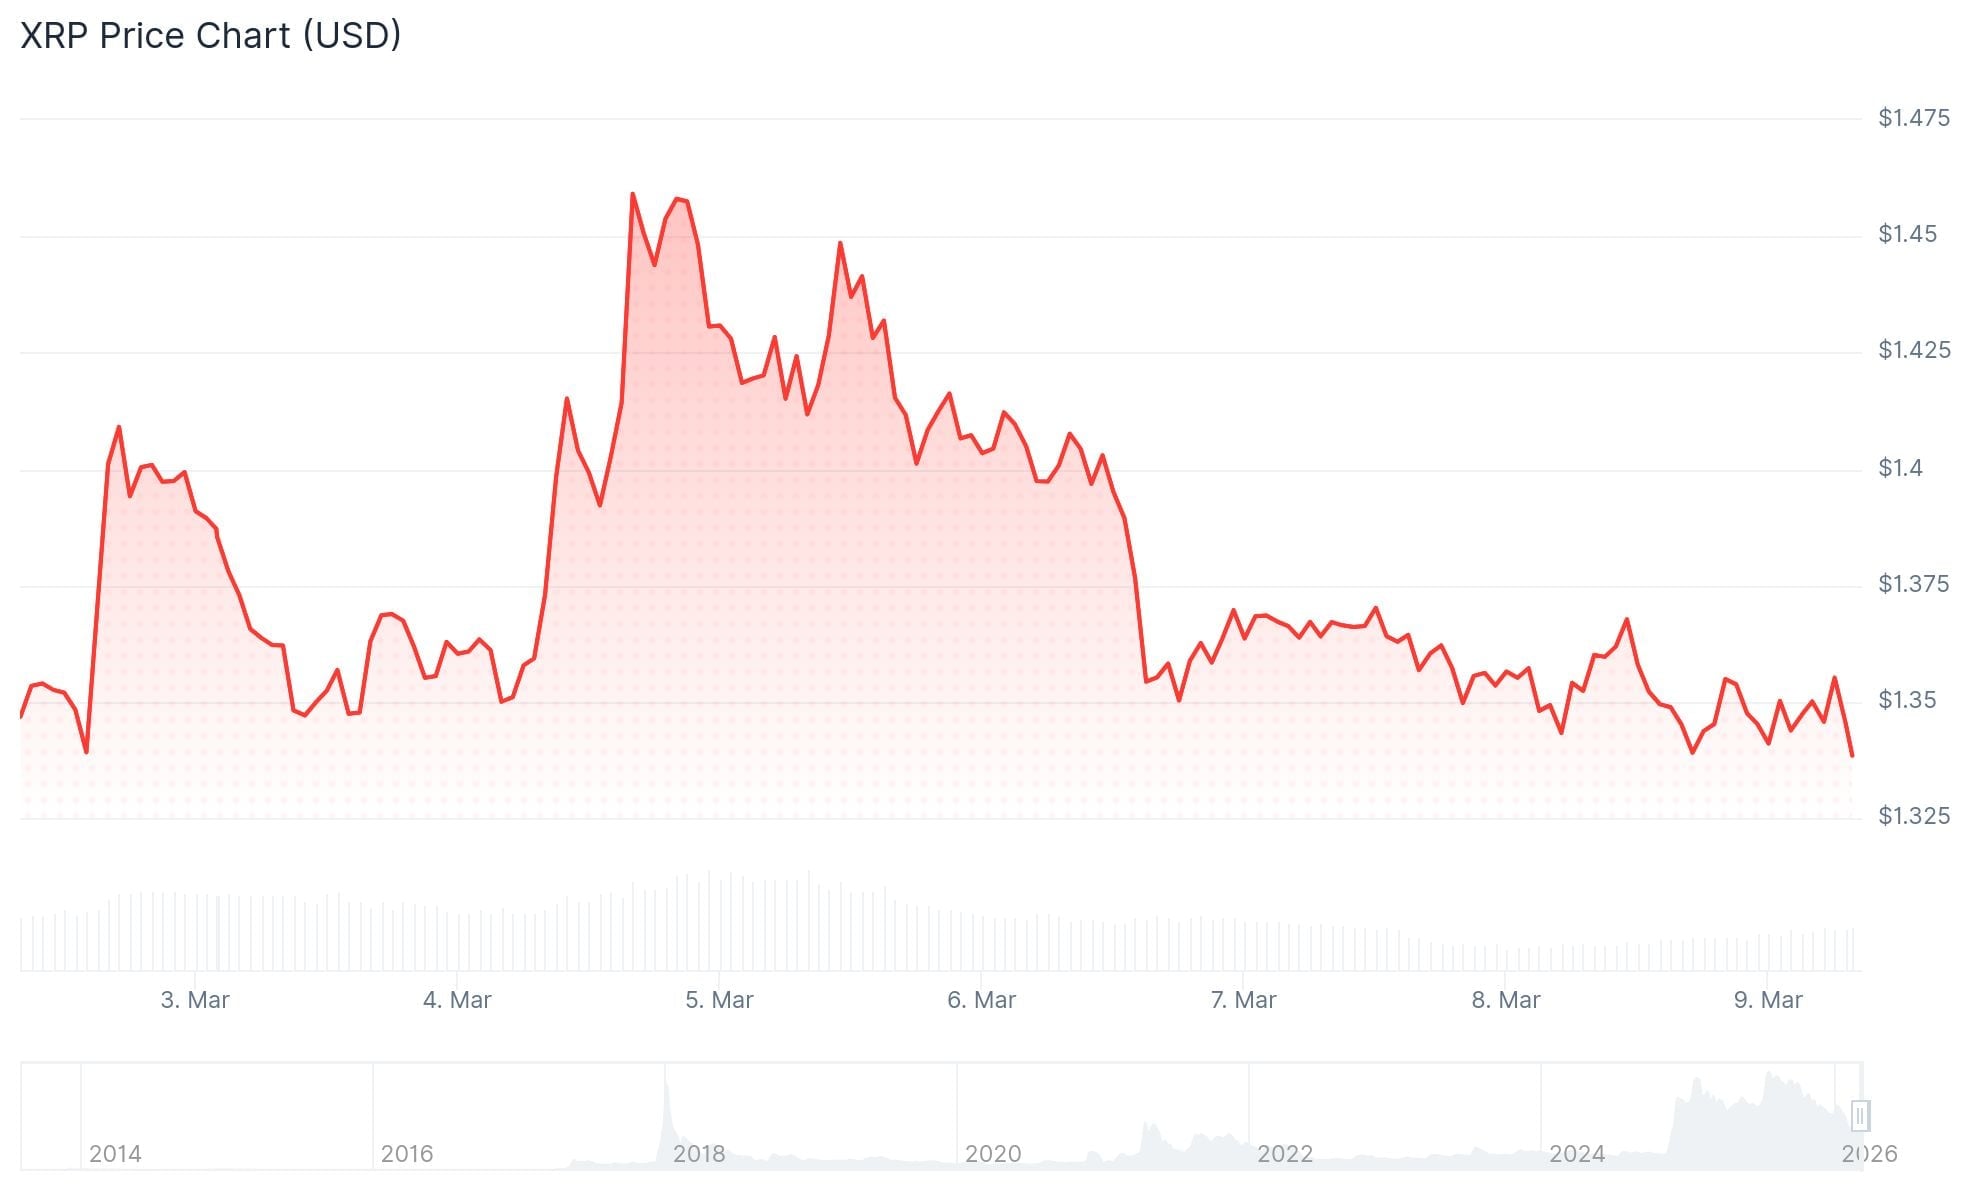
  • XRP currently trades at approximately $1.34, sitting 64% beneath its January 2018 peak of $3.84.
  • Blockchain data reveals 36.8 billion XRP tokens trading below their acquisition price, representing $50.8 billion in paper losses.
  • Critical support rests at the $1.33 level; losing this floor could trigger a decline toward $1.25.
  • Technical indicators including MACD and Chaikin Money Flow suggest continued bearish pressure in the near term.
  • Should Bitcoin fall beneath $60,000, market watchers identify $0.85–$0.95 as XRP’s next significant support area.

XRP finds itself struggling this week, hovering around the $1.34 mark following its inability to maintain crucial price floors. The digital asset has surrendered nearly two-thirds of its value measured from peak levels.

xrp priceXRP Price

Blockchain analytics from Glassnode reveal that 36.8 billion XRP tokens currently trade below their purchase price. This volume represents roughly $50.8 billion in paper losses distributed throughout the XRP ecosystem.

The token reached its all-time peak of $3.84 during January 2018. Today’s valuation places it approximately 64% beneath that historical high.

During 2025, XRP experienced significant upward momentum. The asset surged past $1, then $2, and ultimately breached the $3 threshold, pushing virtually all circulating tokens into profitable territory. That scenario has since completely flipped.

Following a short-lived rebound in January 2026, XRP encountered substantial selling waves throughout February. Since that period, the token has struggled to mount any substantial comeback and continues trending near the bottom of its established trading band.

Technical Levels to Watch

XRP presently trades beneath both the $1.3550 threshold and its 100-hour simple moving average. A descending trend line has emerged on the hourly timeframe, establishing resistance near $1.3520.

The MACD indicator currently rests beneath the zero line, reflecting diminished bullish momentum. The Chaikin Money Flow registers approximately -0.27, indicating persistent capital withdrawal and reinforcing the near-term bearish outlook.

Immediate upside resistance emerges at $1.38. Breaking above this barrier could propel XRP toward $1.40 and possibly $1.50. Conversely, losing the $1.33 support floor exposes $1.30 and deeper levels.

Broader Market Context

The aggregate cryptocurrency market capitalization declined 1.19% to $2.3 trillion over a 24-hour span. Bitcoin decreased 1.12% to $67,166 throughout the same window. Spot Bitcoin ETFs recorded more than $348 million in withdrawals earlier this week.

A market analyst highlighted that should Bitcoin breach the $60,000 threshold, XRP might retest the $0.85–$0.95 zone. A further decline to $0.56–$0.66 would signal complete market capitulation in their assessment.

The present level of loss-making supply approaches benchmarks observed during prior bear cycles, based on Glassnode’s analysis.

XRP most recently traded at $1.34, according to CoinGecko data.

The post XRP (XRP) Price: Unpacking the Massive $51B in Unrealized Losses for Token Holders appeared first on Blockonomi.

Market Opportunity
XRP Logo
XRP Price(XRP)
$1.3572
$1.3572$1.3572
+0.82%
USD
XRP (XRP) Live Price Chart
Disclaimer: The articles reposted on this site are sourced from public platforms and are provided for informational purposes only. They do not necessarily reflect the views of MEXC. All rights remain with the original authors. If you believe any content infringes on third-party rights, please contact crypto.news@mexc.com for removal. MEXC makes no guarantees regarding the accuracy, completeness, or timeliness of the content and is not responsible for any actions taken based on the information provided. The content does not constitute financial, legal, or other professional advice, nor should it be considered a recommendation or endorsement by MEXC.

You May Also Like

Litecoin Fluctuates Below The $116 Threshold

Litecoin Fluctuates Below The $116 Threshold

The post Litecoin Fluctuates Below The $116 Threshold appeared on BitcoinEthereumNews.com. Sep 17, 2025 at 23:05 // Price Litecoin price analysis by Coinidol.com: LTC price has slipped below the moving average lines after hitting resistance at $120. Litecoin price long-term prediction: bearish The 21-day SMA support helped to alleviate the selling pressure. In other words, the price of the cryptocurrency is above the 21-day SMA support but below the 50-day SMA barrier. This suggests that Litecoin will be trapped in a narrow range for a few days. If the 21-day SMA support or the 50-day SMA barrier is overreached, the cryptocurrency will trend upwards. For example, if the LTC price breaks through the 50-day SMA barrier, it will rise to a high of $124. Litecoin will fall to its current support level of $106 if the 21-day SMA support is broken. Technical Indicators  Resistance Levels: $100, $120, $140 Support Levels: $60, $40, $20 LTC price indicators analysis Litecoin’s price is squeezed between the moving average lines. It is unclear in which direction Litecoin will move. The moving average lines are horizontal in both charts. However, the price bars are limited to the distance between the moving averages. The price bars on the 4-hour chart are below the moving average lines. LTC/USD price chart – September 17, 2025 What is the next move for LTC? On the 4-hour chart, Litecoin is currently trading in a bearish trend zone. The altcoin is trading above the $112 support and below the moving average lines, which represent resistance at $116. The upward movement is hindered by the moving average lines, which are causing the price to oscillate within a limited range. Meanwhile, the signal for the cryptocurrency is bearish, with price bars below the moving average…
Share
BitcoinEthereumNews2025/09/18 08:15
XRP Price Watch: Price Action Tightens in Micro Range as Bulls Seek Control

XRP Price Watch: Price Action Tightens in Micro Range as Bulls Seek Control

The post XRP Price Watch: Price Action Tightens in Micro Range as Bulls Seek Control appeared on BitcoinEthereumNews.com. On Sunday, XRP is trading at $2.99 with a market capitalization of $178 billion and a 24-hour trading volume of $3.34 billion. The intraday price range sits narrowly between $2.97 and $3.01, suggesting a temporary equilibrium between buyers and sellers. XRP The 1-hour chart reflects a period of choppy, range-bound trading, typical of market indecision. […] Source: https://news.bitcoin.com/xrp-price-watch-price-action-tightens-in-micro-range-as-bulls-seek-control/
Share
BitcoinEthereumNews2025/09/21 22:41
River Token Plunges 20.8% in 24 Hours: On-Chain Data Reveals Pressure Points

River Token Plunges 20.8% in 24 Hours: On-Chain Data Reveals Pressure Points

River (RIVER) experienced a sharp 20.8% decline to $12.35 within 24 hours, erasing $64 million in market capitalization. Our data analysis reveals concerning volume
Share
Blockchainmagazine2026/03/09 18:04