Ripple crypto (XRPUSDT): Bearish structure in a fearful market, but sellers are losing momentum

In a market gripped by fear, Ripple crypto is stuck in a bearish structure while short-term selling pressure shows signs of fatigue and indecision.
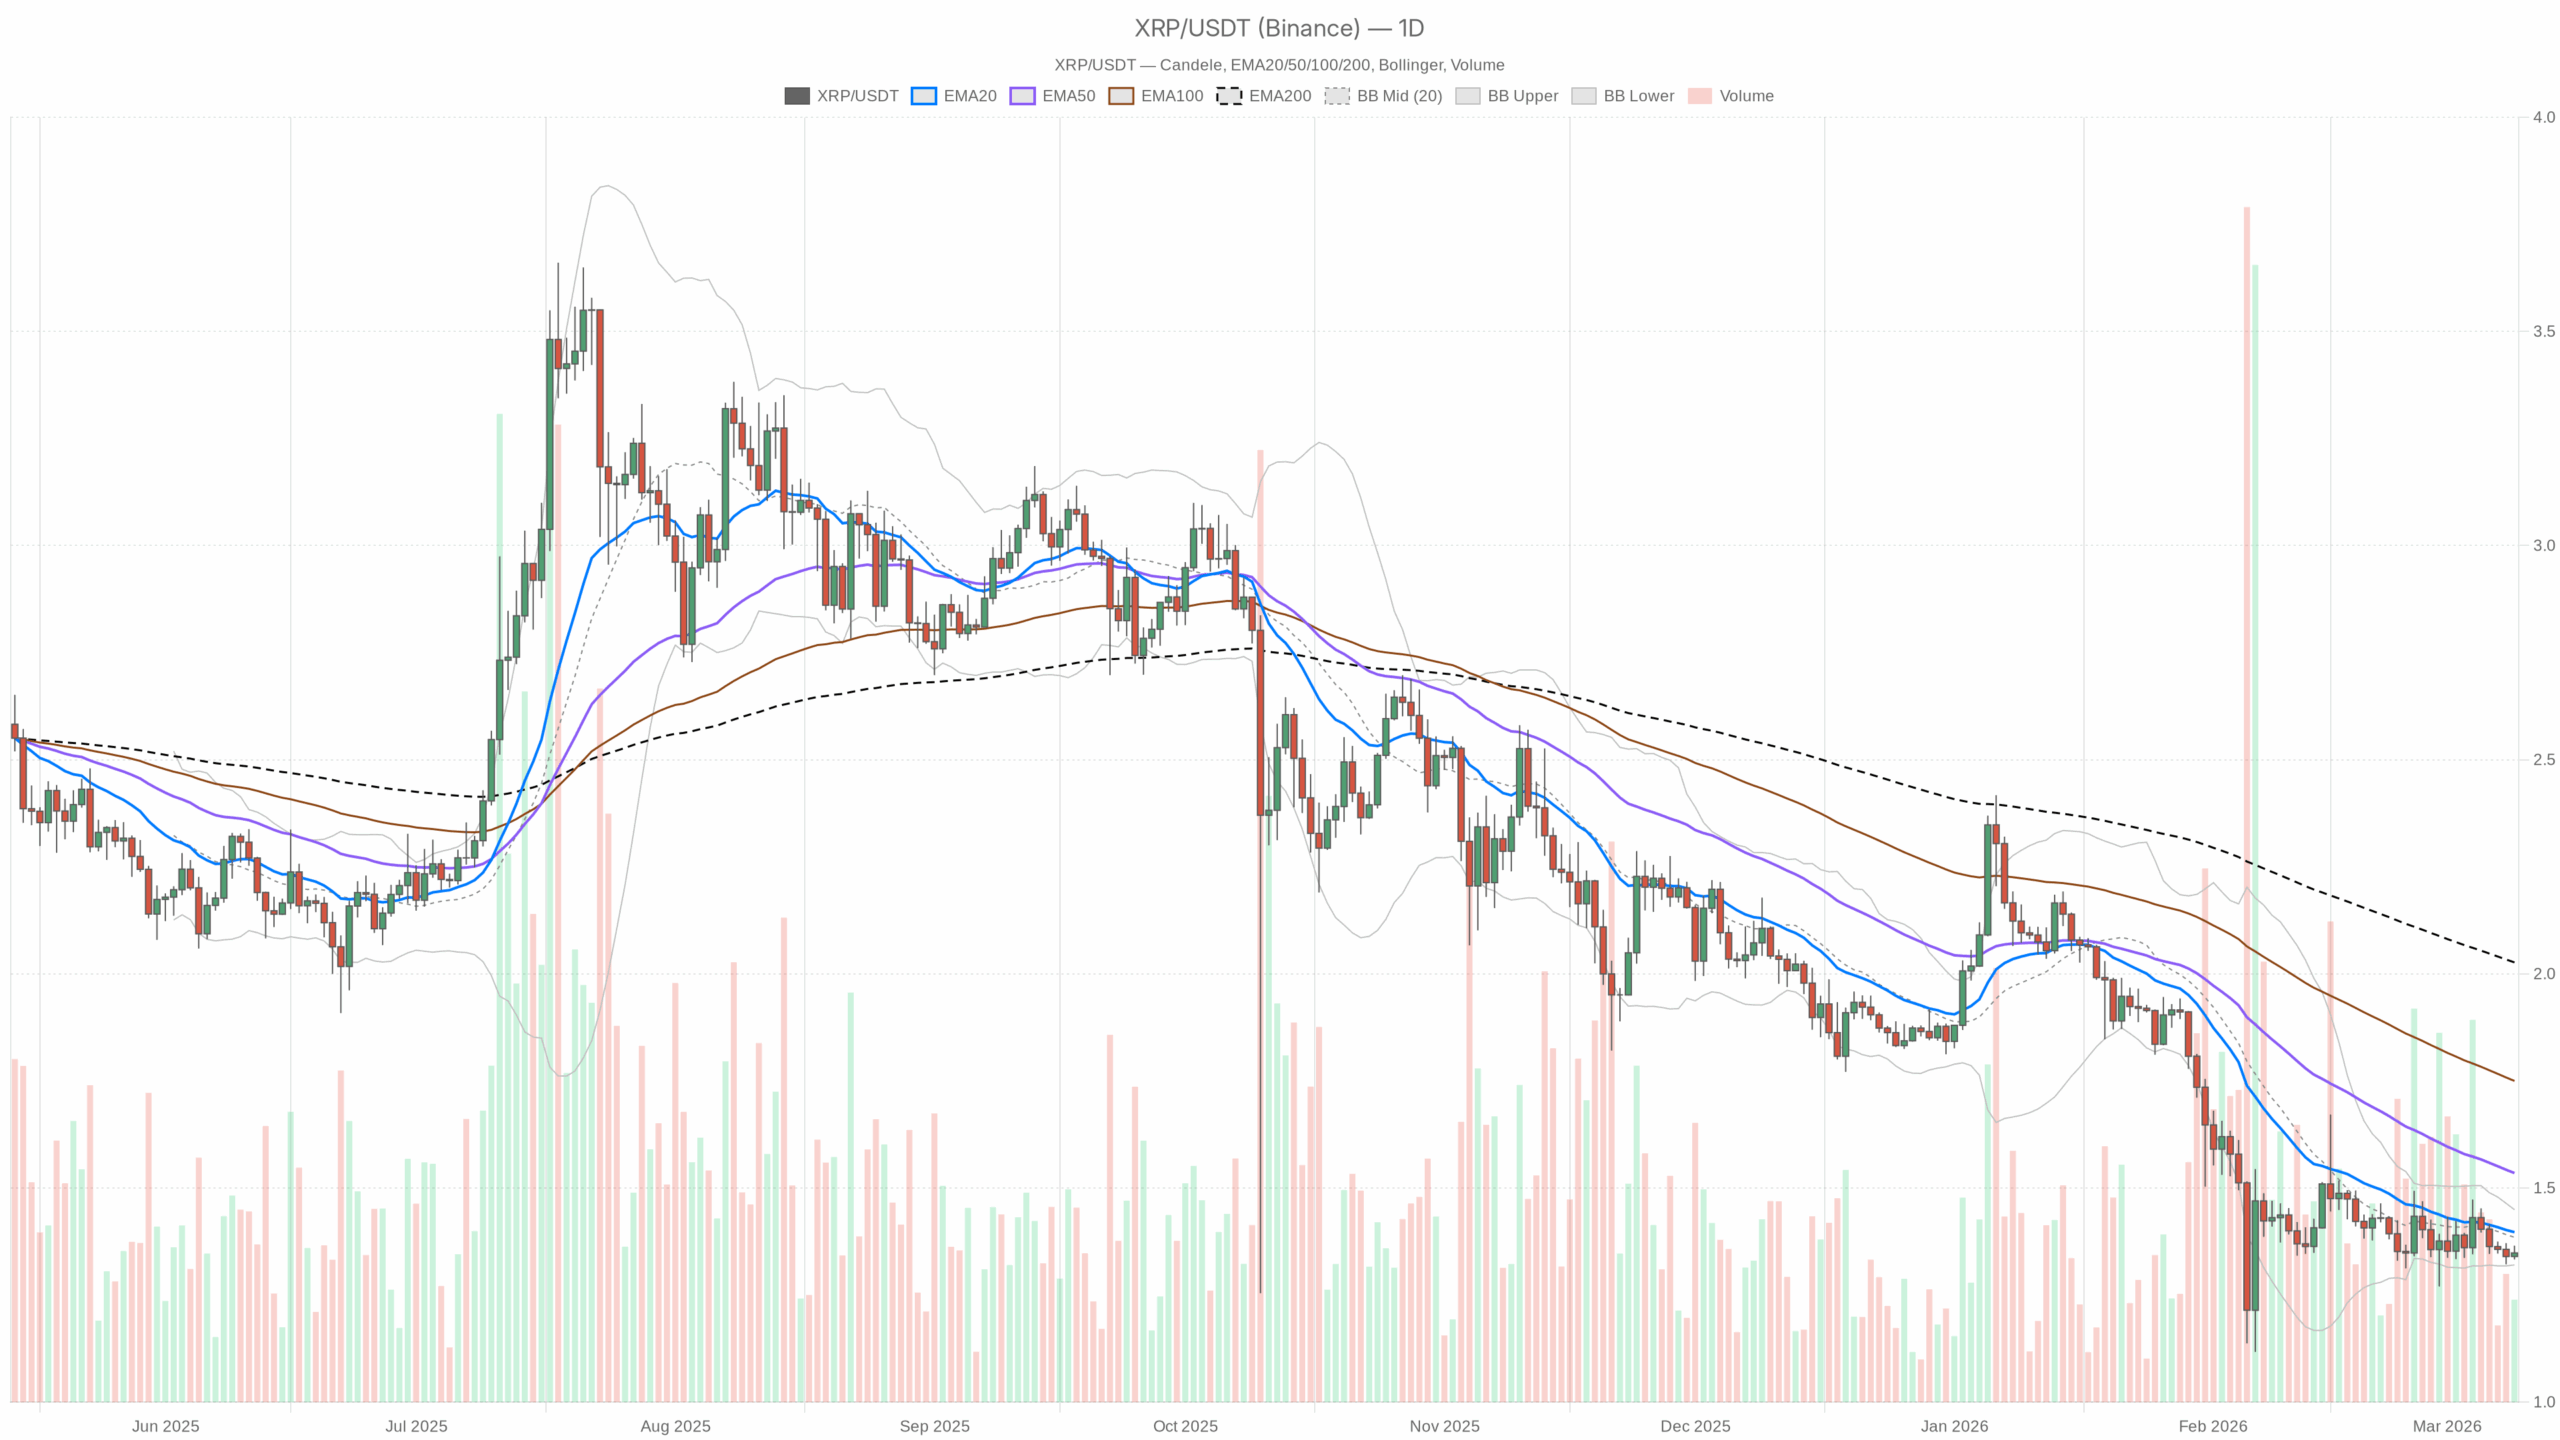 XRP/USDT — daily chart with candlesticks, EMA20/EMA50 and volume.
Big Picture: A Heavy Chart in an Even Heavier Market
XRPUSDT is trading around 1.35, sitting inside a clear daily downtrend while the broader crypto market is under pressure and dominated by fear. Bitcoin dominance is above 56%, the total crypto market cap is slightly red on the day, and the fear & greed index is deep in Extreme Fear (8). This is a classic risk-off backdrop where capital hides in BTC or stables and altcoins like Ripple crypto tend to lag or bleed.
On the daily timeframe, XRP is trading below all key moving averages, with momentum still leaning bearish but no longer accelerating to the downside. Price is hugging the daily pivot at 1.35, volatility is modest, and intraday timeframes (1H and 15m) are flat. In other words, the higher-timeframe trend is still down, but the immediate selling pressure has paused, and the market is trying to figure out whether this is a base or just a pause before another leg lower.
Daily Trend (D1): Bearish Is Still the Main Scenario
The dominant scenario on the daily chart is bearish. The regime flag is explicitly bearish and the trend structure confirms it: price is below the 20, 50, and 200-day EMAs, and the whole moving-average stack is above current price. This is a downtrend until proven otherwise.
However, the bears are no longer in full control the way they were earlier in the move. RSI is in the low 40s, MACD is negative but stabilizing, and Bollinger Bands are relatively tight. That is more controlled grind lower than panic flush. For Ripple crypto, that typically means choppy moves, fake bounces, and slow trend continuation unless a strong catalyst appears.
Daily EMAs: Trend Still Points Down
- Price vs EMAs: Close = 1.35
- EMA20 = 1.40
- EMA50 = 1.53
- EMA200 = 2.03
Price is below all three EMAs, and they are ordered bearishly (20 < 50 < 200 in terms of proximity to price, with all of them above). The 20-day at 1.40 is the first dynamic resistance, the 50-day at 1.53 caps any mid-term bounce, and the 200-day up at 2.03 marks the longer-term bearish overhang.
Human takeaway: Ripple crypto is still trading in the lower half of its recent value area with sellers defending every push into the 1.40–1.50 region. Bulls are playing defense, not offense.
Daily RSI: Bears in Control, But Not Overextended
- RSI (14) = 41.51
RSI is below 50 but well above classic oversold territory. That reflects a market that has been trending down but is not washed out. There is room for another leg lower without triggering a textbook oversold bounce.
Human takeaway: Momentum favors the bears, but this is a grind, not a capitulation. Selling is still the path of least resistance, but it is not a must-short-at-any-price environment.
Daily MACD: Negative, But Flattening
- MACD line = -0.05
- Signal line = -0.05
- Histogram = 0.01
The MACD line and signal are both slightly negative and almost on top of each other, with a tiny positive histogram. That shows the down-momentum has cooled off: the prior bearish impulse has faded, but there is no strong bullish cross yet either.
Human takeaway: Bears no longer have a momentum tailwind, but bulls have not taken over. The market is idling in neutral within a bearish structure.
Daily Bollinger Bands: Price Sitting Near the Midline
- Middle band = 1.38
- Upper band = 1.45
- Lower band = 1.32
- Price = 1.35
Price is slightly below the middle band and closer to the lower band than the upper, but not hugging the edge. Bands are relatively tight: 1.32–1.45 is a narrow range given the absolute price level.
Human takeaway: The market is in a compressed range after a down move. That usually sets up either a continuation drop through 1.32 or a mean-reversion squeeze back to 1.38–1.45. Volatility is coiled rather than expanded.
Daily ATR: Volatility Is Under Control
- ATR(14) = 0.08
An average daily range of roughly 0.08 on a 1.35 asset is moderate. The market is not in a blow-off or liquidation regime; this is controlled two-way trade within a bearish framework.
Human takeaway: Expect grinding moves rather than explosive candles unless a new catalyst hits. Position sizing can more reasonably lean on technical levels instead of extreme intraday noise.
Daily Pivot Levels: Market Sitting Right on the Line
- Pivot point (PP) = 1.35
- Resistance 1 (R1) = 1.36
- Support 1 (S1) = 1.33
Price is pinned at the daily pivot (1.35). The immediate intraday resistance at 1.36 and support at 1.33 are very close by, giving clear short-term boundaries for bulls and bears.
Human takeaway: The market is undecided intraday, stuck on the pivot with very tight support and resistance. Whichever side breaks first, above 1.36 or below 1.33, likely guides the next 24–48 hours.
Intraday Context: 1H and 15m Are Flat Inside a Bearish Shell
1H Chart: Bearish Bias, But Completely Balanced
- Price = 1.35
- EMA20 = 1.35
- EMA50 = 1.35
- EMA200 = 1.37
- RSI(14) = 48.9
- MACD: line ≈ 0, signal ≈ 0, histogram = 0
- Bollinger mid = 1.35 (1.34–1.36 band)
- ATR(14) = 0.02
- Pivot: PP = 1.35, R1 = 1.35, S1 = 1.34
On the hourly, price is glued to the short EMAs and the Bollinger midline, with RSI almost at 50 and MACD flat. The only real bearish tell is that the EMA200 at 1.37 still sits above price, acting as a higher-timeframe intraday cap.
Human takeaway: The 1H is in a holding pattern under a larger downtrend. The market is catching its breath, not reversing. Any push into 1.37–1.40 will meet a wall of supply unless volume kicks in.
15-Minute Chart: Neutral Microstructure
- Price = 1.35
- EMA20 = 1.35
- EMA50 = 1.35
- EMA200 = 1.36
- RSI(14) = 49.42
- MACD: line ≈ 0, signal ≈ 0, histogram = 0
- Bollinger mid = 1.35 (1.34–1.36 band)
- ATR(14) = 0.01
- Pivot: PP = 1.35, R1 = 1.35, S1 = 1.35
The 15m regime is marked as neutral, and the numbers confirm it: flat EMAs, flat MACD, RSI near 50, and a very tight band. This is pure micro-range price action.
Human takeaway: On execution level, this is a scalper’s market. For swing traders, the 15m is just noise inside a larger downtrend and does not change the bias.
Market Environment: Extreme Fear, BTC-Led Flows
The broader market is in Extreme Fear with a fear & greed value of 8. Bitcoin dominance at about 56.5% shows who is in charge. Total crypto market cap is slightly down on the day (around -0.04%) with volumes sharply higher in the last 24 hours (approximately +54%).
Human takeaway for Ripple crypto: This is not the kind of environment where altcoins usually lead sustained rallies. Capital is defensive, liquidity clusters around BTC, and alt bounces are more likely to be sold into unless sentiment improves broadly.
Scenarios for XRPUSDT (Ripple Crypto)
Bullish Scenario: Range Reclaim and Mean Reversion
For the bullish case, traders are not betting on a new macro uptrend yet; they are betting on a squeeze inside a bearish structure.
What bulls want to see:
- On the intraday side, a clean break and hold above 1.36 (daily R1 and above the tight 1H/15m range).
- Then a push through the daily middle Bollinger band at 1.38, ideally on expanding 1H volume.
- Short-term momentum turning up: RSI crossing sustainably above 50 on D1 and H1, and MACD flipping clearly positive on the lower timeframes.
- Targets in that case are the 1.40 EMA20 first, and then the 1.45 upper Bollinger band. Stretch target for a more aggressive mean reversion would be the 1.50–1.53 zone near the EMA50.
What would invalidate the bullish scenario: A decisive daily close back below 1.33 (S1) with RSI staying sub-45 and MACD rolling back deeper into negative territory. That would confirm that the bounce attempt was just sellers reloading higher.
Bearish Scenario: Trend Continuation and Support Slippage
The current environment still favors the bears on the higher timeframe. Until daily structure changes, the simpler trade is to assume rallies are for selling.
What bears want to see:
- Failure to reclaim 1.38–1.40 (daily mid-band and EMA20). Rejections from that area would show that the downtrend is intact.
- An intraday breakdown from the current range: a sustained move below 1.33, ideally with ATR picking up and 1H RSI slipping into the low 40s or below.
- Daily RSI drifting from 41 toward the mid-30s, and MACD lines widening again on the downside instead of staying flat.
- In that case, the first logical zone is the lower Bollinger band near 1.32. If fear persists across the crypto market, a break of 1.32 opens the way for a deeper leg, where the market hunts for fresh liquidity lower (sub-1.30).
What would invalidate the bearish scenario: A daily close above the 1.40 EMA20 followed by continuation toward 1.45, with RSI reclaiming above 50. That would mark the first meaningful sign that the downtrend is losing its grip and that this is evolving into a larger corrective phase.
How to Think About Positioning and Risk
XRPUSDT is in a bearish daily trend with neutral intraday momentum, inside a market dominated by fear and by Bitcoin. That mix typically rewards patience and disciplined levels rather than aggressive directional bets.
For traders focused on Ripple crypto:
- Recognize that the daily bias is still down: any long exposure is effectively a counter-trend play until the 1.40–1.50 area is reclaimed.
- Shorts have structural backing from the EMAs and the macro backdrop, but they are chasing into moderate (not extreme) volatility. Timing around 1H and 15m range breaks (1.36/1.33) matters a lot.
- With ATR relatively low, leverage can feel safe, but ranges can still break quickly if market-wide sentiment shifts or BTC makes a sharp move.
Bottom line, Ripple crypto is weak but not broken, quiet but not stable. The daily chart still argues for caution on the long side, while intraday charts show that the next impulse, up or down, has not been decided yet. In this kind of tape, levels matter more than opinions, and respecting invalidation points around 1.33 on the downside and 1.40 on the upside is key to staying in control of risk.


You May Also Like

FootballersCV Launches Professional Football CV Platform Connecting Players With Scouts, Agents, and Clubs Worldwide

Safe Havens Are Failing — Why Gold, Silver, and Crypto Are All Falling Together