

Tron Crypto (TRXUSDT) Calm Price, Violent Sentiment: Coiled Spring or Just Dead Air?

The current setup around Tron crypto is defined by flat price action, compressed volatility, and a sharp disconnect between calm charts and fearful sentiment.
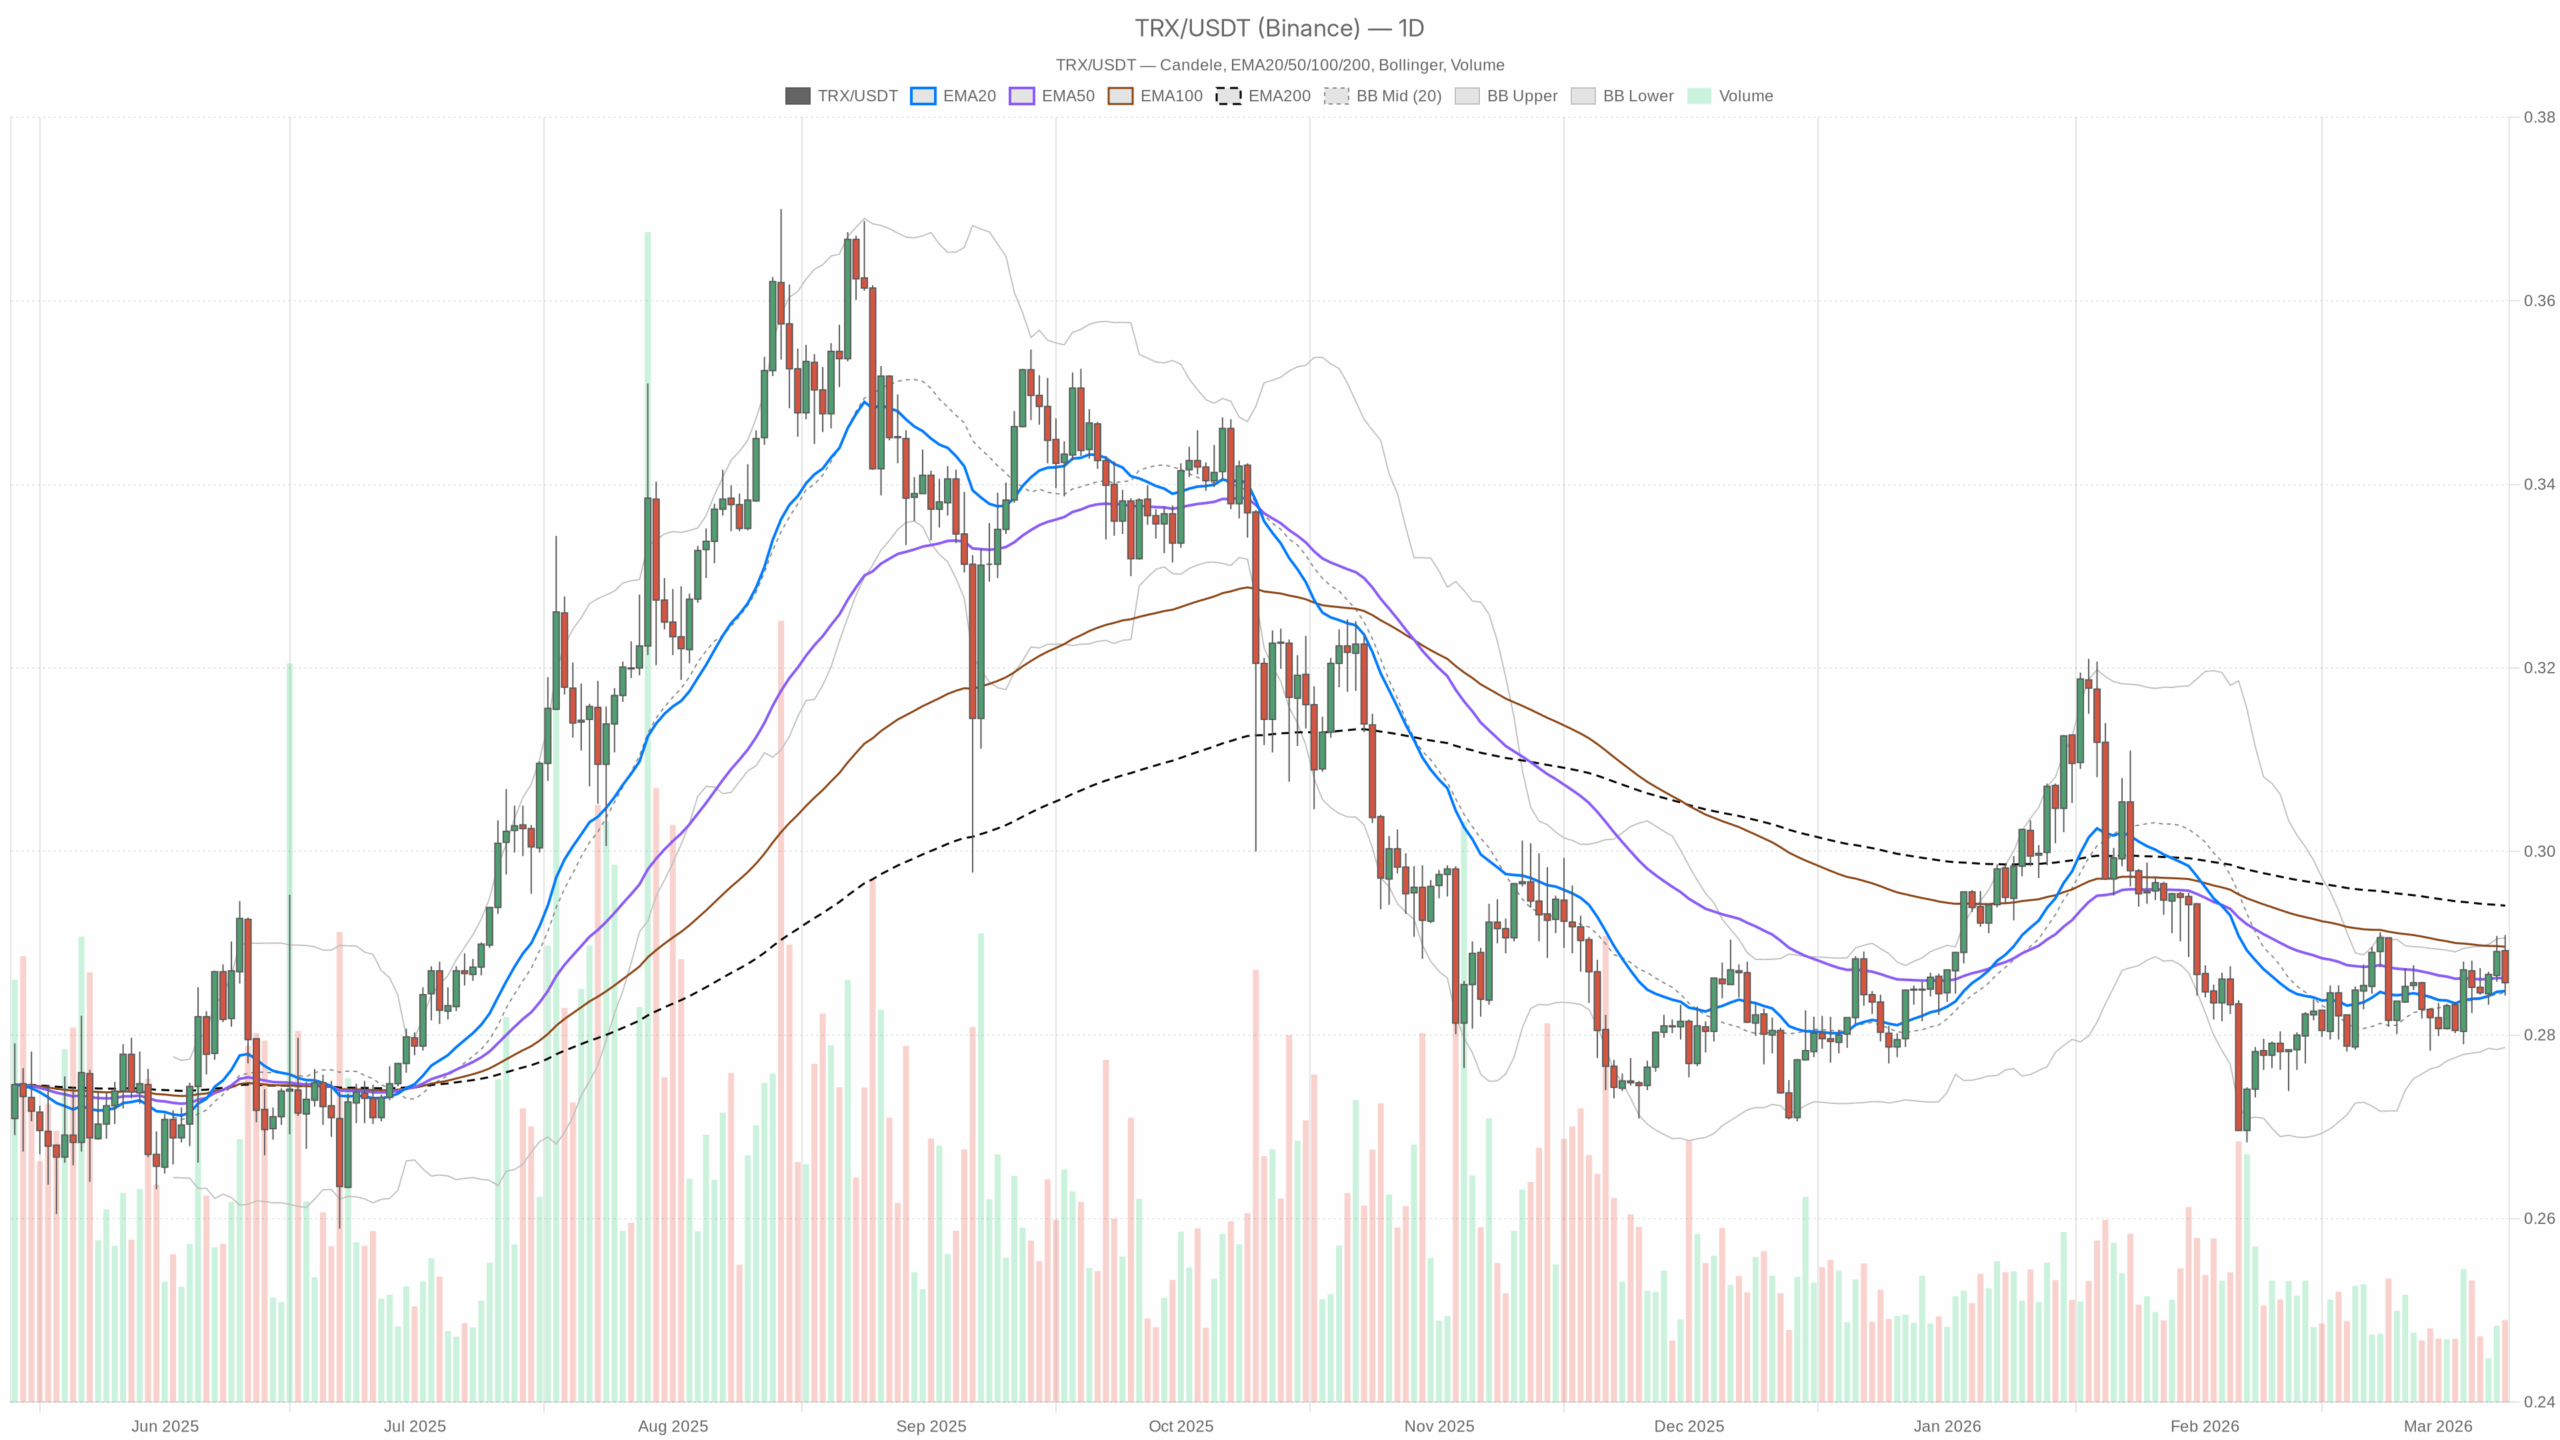 TRX/USDT — daily chart with candlesticks, EMA20/EMA50 and volume.
Thesis: Price Calm, Sentiment in Panic – Tron Is in a Holding Pattern
Tron crypto (TRXUSDT) is sitting almost perfectly flat around $0.29 on every timeframe we have – daily, 1‑hour, and 15‑minute. All the moving averages are essentially on top of price, MACD is flat, and ATR is reading as near-zero. Technically, this is a market with no immediate direction and extremely compressed volatility.
What makes this moment interesting is the backdrop: the total crypto market cap is up about 3% in 24 hours, BTC dominance is above 56%, and yet the fear & greed index is deep in Extreme Fear (8). So you have a risk-on bounce happening while sentiment looks like a crash. In that context, Tron looks less like a trending play and more like a coin waiting for its next catalyst.
On the daily chart, the regime is explicitly marked as neutral and the indicators confirm it. The main scenario right now is neutral with a slight bullish bias: the trend is not clearly up or down. However, price holding above short-term support in an environment of washed-out sentiment often favors upside resolution if a broader market risk-on phase continues.
Daily (D1): Neutral Bias, Price Pinched Around $0.29
Trend Structure – EMA20 / EMA50 / EMA200
Close ≈ $0.29; EMA20 ≈ $0.28; EMA50 ≈ $0.29; EMA200 ≈ $0.29.
Interpretation: Trx crypto is trading right on top of its medium- and long-term moving averages, with the 20‑day slightly below price. That points to a market that has recently cooled off from an up-move and is now consolidating. There is no clean bullish or bearish trend here – it is more of a sideways equilibrium, with a mild edge to the upside as long as price holds above the 20‑day EMA.
RSI (Daily)
RSI14 ≈ 51.1.
Interpretation: RSI sitting almost dead in the middle of the range confirms the lack of directional conviction. Tron is neither overbought nor oversold on the daily chart; momentum traders do not have a strong reason to push aggressively in either direction yet. In other words, the market is waiting for a reason to care.
MACD (Daily)
MACD line ≈ 0, signal ≈ 0, histogram ≈ 0.
Interpretation: MACD being flat at the zero line is the technical equivalent of a shrug. There is no current follow-through from bulls or bears. It usually appears after a trend has run its course and before a new leg develops. It reinforces the idea that TRX is in a transition zone rather than a strong trending phase.
Bollinger Bands (Daily)
Mid band ≈ $0.28; upper band ≈ $0.29; lower band ≈ $0.28.
Interpretation: The bands are extremely tight and essentially wrapped around $0.28–0.29. This is classic volatility compression. Tron is trading inside a very narrow range; when that eventually breaks, it usually comes with a sharper move. The bands are not telling you direction, just that the current calm will not last forever.
ATR (Daily)
ATR14 ≈ 0 (effectively extremely low volatility in this data snapshot).
Interpretation: Daily range has collapsed. That means breakout trades will likely have a better payoff than mean-reversion scalps once volatility returns. Until then, the chart offers little for momentum traders. It is a low-volatility coil.
Daily Pivot Levels
Pivot point (PP) ≈ $0.29; R1 ≈ $0.29; S1 ≈ $0.28.
Interpretation: The pivots being stacked near the same price underlines the cramped range. The market is treating roughly $0.29 as the fair value magnet, with first meaningful support only a cent lower around $0.28. As long as price keeps closing near the pivot, the market is acknowledging the stalemate.
1‑Hour (H1): Short-Term Weakness Inside a Flat Structure
On the 1‑hour chart, the regime is also tagged as neutral, but the tone is a bit softer.
Trend & EMAs (H1)
Close ≈ $0.29; EMA20 ≈ $0.29; EMA50 ≈ $0.29; EMA200 ≈ $0.29.
Interpretation: All three EMAs are essentially overlapping price. Intraday, the market has no directional edge. There is no intraday trend to lean on; TRX is drifting sideways in a tight band.
RSI (H1)
RSI14 ≈ 37.9.
Interpretation: Hourly RSI is leaning slightly toward the bearish side of neutral. It is not oversold, but it does show mild intraday selling pressure or at least a lack of aggressive dip-buying. Therefore, while the daily chart is balanced, the short-term flows have a small downward bias.
MACD (H1)
MACD line ≈ 0, signal ≈ 0, histogram ≈ 0.
Interpretation: Again, flat MACD aligns with the overlap in EMAs: momentum on the 1‑hour is basically neutral. Any small intraday pushes are getting faded rather than turning into trends.
Bollinger Bands & Pivots (H1)
BB mid ≈ $0.29; upper ≈ $0.29; lower ≈ $0.28. Pivot point ≈ $0.29; R1 ≈ $0.29; S1 ≈ $0.29.
Interpretation: Bands and pivot clustering show that intraday traders are operating within an extremely tight spread. Liquidity is probably decent, but there is no appetite to chase price in either direction at the moment. H1 does not confirm any strong bullish or bearish narrative; it only hints at a small downward lean via RSI.
15‑Minute (M15): Execution Timeframe – Pure Sideways Tape
EMAs & Structure (M15)
Close ≈ $0.29; EMA20 ≈ $0.29; EMA50 ≈ $0.29; EMA200 ≈ $0.29.
Interpretation: On the execution timeframe, Tron crypto is as flat as it gets. All EMAs are aligned with price, so there is no micro-trend to play. This is the kind of tape where you either fade the very edges of the range or you wait for a clear breakout.
RSI & MACD (M15)
RSI14 ≈ 48.7; MACD line ≈ 0, signal ≈ 0, histogram ≈ 0.
Interpretation: Short-term momentum is neutral. There is no strong buying or selling pressure at the micro level. This supports the idea that any size move from here will be liquidity-driven or catalyst-driven rather than a smooth trend extension.
Bollinger Bands & Pivots (M15)
BB mid ≈ $0.29; upper ≈ $0.29; lower ≈ $0.28. Pivot ≈ $0.29; R1 ≈ $0.29; S1 ≈ $0.29.
Interpretation: In the very short term, $0.29 is the gravity point. With bands this tight, breakout traders will be watching for a clean move through either the local highs near $0.29+ or the local lows closer to $0.28 to initiate positions.
Market Context: Extreme Fear with a Macro Bounce
The broader market adds an important layer here:
- Total crypto market cap: ≈ $2.43T, up about 3% over 24h.
- BTC dominance: ≈ 56.7% – Bitcoin still firmly in charge.
- Fear & Greed Index: 8 – Extreme Fear.
- Tron (TRX) market cap share: ≈ 1.11% of total crypto.
This is an unusual combination: prices stabilizing or bouncing while sentiment is still extremely depressed. Historically, that kind of environment can favor coins with stable on-chain demand and strong ecosystem activity.
On Tron, DeFi fee data shows that SUNSwap (V1–V3) continues to generate meaningful all-time and average daily fees, though recent percentage changes are volatile across versions. That tells you there is still real usage and liquidity on the network, even if token price is asleep. For Tron crypto, that kind of fundamental activity often acts as a floor during risk-off phases and a lever during risk-on phases.
Scenarios for Tron Crypto (TRXUSDT)
Bullish Scenario – Breakout from Volatility Compression
In the bullish case, the current sideways coil is a base, not a top.
- Structure: Price continues to hold above the daily EMA20 (~$0.28) and uses $0.28 as a support zone.
- Momentum: Daily RSI grinds up from ~51 toward the 55–60 region, and MACD starts to lift away from the zero line to the upside.
- Volatility: Bollinger Bands widen with price riding the upper band rather than chopping the midline. ATR picks up from the current depressed levels.
- Market context: If the broader market risk-on move extends (total market cap continues to rise, BTC dominance stabilizes or dips), Tron can attract rotation flows as a large-cap with active DeFi usage.
Targets in a bullish breakout: Traders would first look for a clean hold above the current pivot area (~$0.29) and then for continuation into prior swing highs (not provided in the snapshot, but conceptually the next resistance band above $0.29). The key is not the exact cents, but whether TRX can convert $0.29–0.30 from a ceiling into a floor on closing prices.
What invalidates the bullish scenario?
- Daily closes back below the EMA20 (~$0.28) with RSI rolling down toward the low 40s.
- A downside expansion in ATR where price hugs the lower Bollinger Band instead of the upper.
- Broader market risk reverses sharply (total market cap loses the recent 3% gain and BTC dominance spikes higher), signaling renewed risk-off.
Bearish Scenario – Breakdown from a Topping Range
In the bearish view, this is a distribution range before a leg lower.
- Structure: TRX fails to build on $0.29 and instead starts to print lower highs intraday, leaning on $0.28 more frequently.
- Momentum: Hourly RSI, already leaning bearish, drops closer to or below 30, and this weakness starts bleeding into the daily RSI, pulling it under 45.
- Volatility: Bands widen to the downside, with candles expanding below the lower band and ATR rising.
- Macro overlay: If fear remains extreme and the market’s current relief rally fails, high‑beta coins like Tron can see outsized drawdowns even from flat levels.
Downside focus: The first key zone is around $0.28 (S1 and near the daily lower band). A decisive break and daily close below that would open the door to a broader correction, depending on where the next historical supports sit.
What invalidates the bearish scenario?
- Repeated defenses of $0.28 with long lower wicks, showing buyers are stepping in there.
- Hourly and 4‑hour RSI holding above 40 despite dips, while price refuses to make new local lows.
- A sustained push above the current pivot cluster ($0.29) with rising volume and a recovering daily RSI.
Neutral / Range-Bound Scenario – The Stalemate Continues
Given how compressed every indicator is, the neutral scenario cannot be ignored and is, in fact, the current base case.
In this path, Tron crypto simply continues to oscillate around $0.29, pinging between $0.28 support and modest resistance just above $0.29, while:
- Daily RSI hangs in the mid‑40s to mid‑50s.
- MACD stays flat near zero.
- EMAs keep clustering with price.
- Bollinger Bands remain relatively tight with only a slow, gradual expansion.
This is the kind of environment where swing traders often step aside or trade the range edges with tight risk, while longer-term participants simply hold and wait for a clearer structure.
Positioning, Risk, and Uncertainty
Right now, Tron is not offering a strong directional edge. The daily chart says neutral, the 1‑hour shows slight softening via RSI, and the 15‑minute is pure chop. At the same time, the market backdrop is highly emotional (Extreme Fear) despite a macro bounce in total crypto capitalization.
That combination calls for respect of two risks:
- Breakout risk: With volatility this compressed, the next move could be sharp. Waiting for confirmation (for example, closes outside the tight range and follow-through) is more important than guessing direction.
- Sentiment whiplash: Extreme fear can quickly flip to aggressive dip-buying if the rally broadens, or it can be justified by a new leg lower if macro risk sours. Tron, as a major alt with active DeFi usage, will likely amplify those swings rather than dampen them.
For now, the chart is telling you to pay attention, not to overcommit. Tron is coiling at $0.29, and the next meaningful data points will be whether it can defend $0.28 on pullbacks and whether it can turn this tight sideways band into a base for the next move rather than a ceiling before a drop.


You May Also Like

Trump insider admits 90% of White House spokespeople 'don't believe what they're saying'

Iran seizes cargo ships in Strait of Hormuz amid US ceasefire extension


