

Bitcoin Back Toward $70K as US-Iran Tensions Ease: Here are the Two Next Possibilities
Bitcoin price climbed back toward the $70,000 zone after geopolitical tension between the United States and Iran began to cool. Global markets reacted almost immediately to the calmer tone in the Middle East, and BTC price moved higher as risk appetite slowly returned across financial markets.
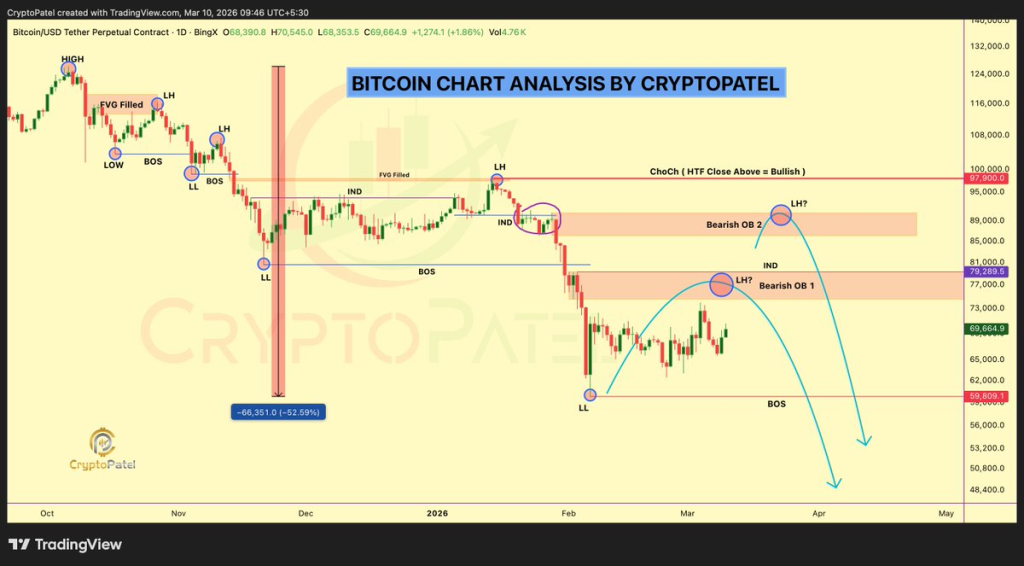
That recovery has reopened the discussion about Bitcoin’s next major move. Crypto analyst Crypto Patel recently shared a detailed BTC chart analysis that points to two possible paths for Bitcoin price in the coming weeks. His outlook focuses on several key resistance zones that could determine whether BTC price continues upward or faces another rejection.
Bitcoin spent several weeks under pressure as geopolitical uncertainty spread across global markets. Risk assets such as crypto often react quickly when tensions escalate, and BTC price saw a sharp decline earlier in the year as investors moved toward safer assets.
Recent developments have changed that tone. Bitcoin climbed back toward the $70,000 level as fears surrounding the US Iran situation began to fade. That move matters because the $70,000 region has acted as a psychological pivot during previous market cycles.
Crypto Patel explained that reclaiming this level shows buyers remain active despite earlier volatility. His chart analysis shows Bitcoin moving upward toward an important resistance zone that sits above current price levels.
That zone becomes the key battlefield for the next stage of the BTC price trend.
 Source: @CryptoPatel / X
Crypto Patel Chart Shows Two Major Resistance Zones For Bitcoin Price
The chart shared by Crypto Patel outlines two areas where Bitcoin could face heavy resistance if the current recovery continues.
The first resistance zone sits between $75,000 and $79,000. The chart labels this region as Bearish Order Block 1. Order blocks represent areas where large sell orders previously entered the market. Those zones often attract renewed selling pressure when price revisits them.
Bitcoin price would need strong buying pressure to push through that first barrier. A rejection there could send BTC price back toward lower support levels.
The second resistance zone appears higher on the chart between $86,000 and $90,000. Crypto Patel marked this area as Bearish Order Block 2. That zone represents the final major resistance before Bitcoin can attempt a new leg toward six figure territory.
Read Also: ONDO Price Prediction: Analyst Says ONDO Could Rally 24x From Here Despite the 90% Crash
The chart also shows a clear pattern of lower highs that formed earlier in the year. Bitcoin previously printed a high near the $97,000 level before entering a steep correction that sent BTC price down more than 50%.
Recent price action shows Bitcoin forming a local bottom near $59,000. Price then rebounded strongly and began climbing again. That structure leaves the market positioned between major support and two potential resistance barriers.
$60,000 Support Remains Critical For The Bitcoin Price Structure
Crypto Patel also pointed to an important support level that must hold for the bullish outlook to remain intact.
The $60,000 area sits just above the most recent market low. A break below that region would weaken the recovery structure and open the door for deeper downside pressure.
Read Also: Read Also: Kaspa Crisis? Analysts Clash Over What Could Save KAS Price After 80% Collapse
His chart shows a possible path where Bitcoin tests the first resistance zone near $75,000 to $79,000. Price reaction there could determine the next phase. Strong buying could push BTC price toward the higher resistance zone near $90,000. A rejection could send Bitcoin back toward the $60,000 support area before another attempt upward. That structure creates two clear scenarios for traders to watch.
Bitcoin could continue climbing toward the resistance zones identified on the chart. Another possibility involves a temporary rejection that sends BTC price lower before the market attempts another rally.
Subscribe to our YouTube channel for daily crypto updates, market insights, and expert analysis.
The post Bitcoin Back Toward $70K as US-Iran Tensions Ease: Here are the Two Next Possibilities appeared first on CaptainAltcoin.


You May Also Like

Citi Warns Bitcoin Is More Vulnerable to Quantum Computing Attacks Than Ethereum
Why Tether’s LemFi Deal Could Transform International Remittances


