

Bitcoin’s Apparent Demand Broke Down Six Steps Before the Price Did: Here Is the Full Sequence
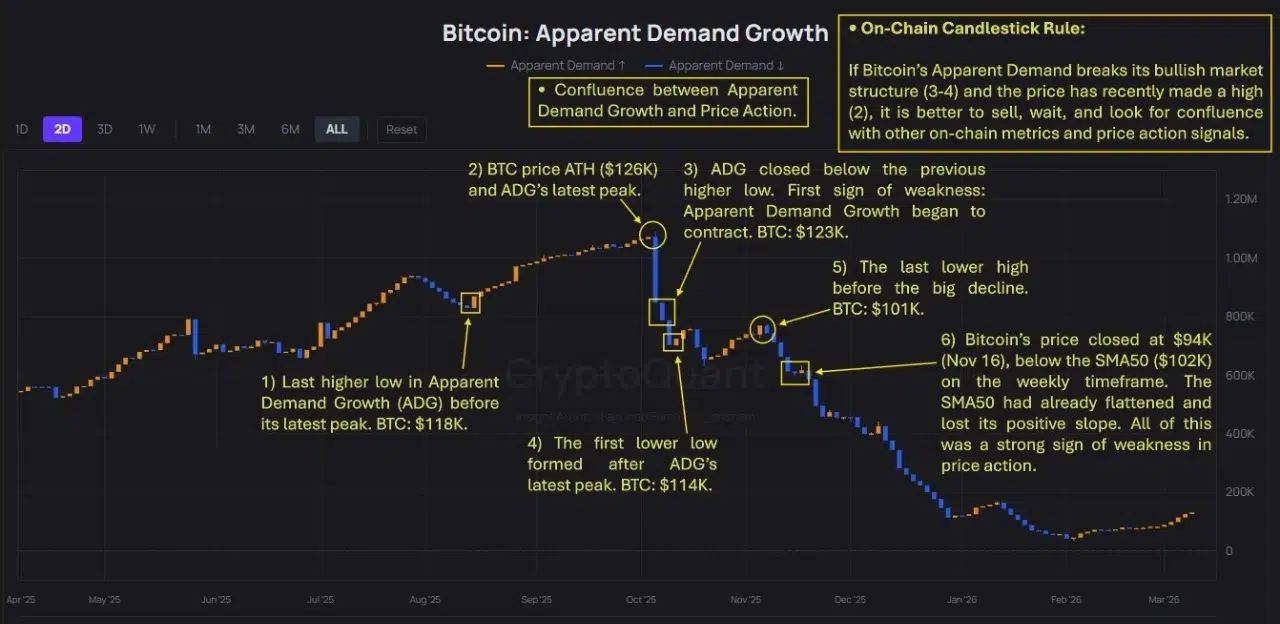
CryptoQuant’s Apparent Demand Growth metric flagged the top of Bitcoin’s cycle before price confirmed it, producing a six-step deterioration sequence from the $126,000 ATH in October 2025 to the current level near $70,000 that was visible in on-chain data before it appeared in price action.
The Six-Step Sequence
The chart annotates the breakdown with precision that is worth reading in order.
Step one: Bitcoin trades at $118,000 and Apparent Demand Growth records its last higher low before the eventual peak. Demand is still expanding, still making higher lows, still in a bullish structure. Nothing in the price action suggests a top is forming.
 Source: https://cryptoquant.com/insights/quicktake/69b1915b8792916e61ec6a88-Bitcoin-Apparent-Demand-On-Chain-Candlestick-Rules
Step two: Bitcoin reaches its all-time high of $126,000. ADG simultaneously records its latest peak. Price and demand peak together. At this moment the on-chain signal and the price are aligned. Both look healthy.
Step three is where the divergence begins. ADG closes below its previous higher low at $123,000. This is the first sign of weakness. Demand is contracting while price is still elevated. The bullish market structure in ADG, defined by a series of higher lows, has broken. Price has not confirmed this yet.
Step four: the first lower low in ADG forms after the peak, with Bitcoin at $114,000. Demand structure is now definitively broken. Lower high followed by lower low is a bearish sequence in any market. Bitcoin is still above $110,000.
Step five: the last lower high before the major decline, with Bitcoin at $101,000. Each ADG lower high is accompanied by a price that is also lower, but the price decline at this stage has been gradual. The on-chain demand data has been deteriorating for weeks.
Step six arrives on November 16 when Bitcoin closes at $94,000, below the weekly SMA50 at $102,000. The SMA50 had already flattened and lost its positive slope before this close. The weekly close below a flattening SMA50 while ADG is in a confirmed downtrend represents the confluence of on-chain weakness and price action weakness that the framework identifies as the signal to act.
What the Framework Is Teaching
The On-Chain Candlestick Rule embedded in the chart states the principle directly: if Apparent Demand breaks its bullish market structure after price has recently made a high, it is better to sell, wait, and look for confluence with other on-chain metrics and price action signals.
The sequence described here is the textbook example of that rule applied in real time. The top was not a single moment. It was a process that played out across six identifiable steps over several weeks. Each step was visible before the next one confirmed it. An analyst watching ADG in real time had multiple decision points before the full decline materialized.
The current ADG reading at the far right of the chart shows the metric near the bottom of its range following months of blue declining bars. The question the chart leaves open is whether the current level represents the same kind of accumulation base that preceded the 2025 rally, when ADG built its last higher low at $118,000, or whether the demand destruction runs deeper than prior cycle lows suggest.
The six-step breakdown took months to play out from top to confirmation. Recoveries in ADG have historically taken comparable time to build the structure that supports the next advance.
The post Bitcoin’s Apparent Demand Broke Down Six Steps Before the Price Did: Here Is the Full Sequence appeared first on ETHNews.


You May Also Like

Nvidia (NVDA) Earnings, Treasury Yields, and Retail Reports Highlight This Week’s Market Focus
Jump Crypto Quietly Launches Firedancer on Solana Mainnet


