HBAR price prediction shows consolidation around $0.10 with potential upside to $0.11 in April. Technical indicators remain neutral as Hedera faces key resistanceHBAR price prediction shows consolidation around $0.10 with potential upside to $0.11 in April. Technical indicators remain neutral as Hedera faces key resistance

HBAR Price Prediction: Targets $0.11 by April 2026 Amid Neutral Technical Signals

2026/03/16 18:25
4 min read
For feedback or concerns regarding this content, please contact us at crypto.news@mexc.com

HBAR Price Prediction: Targets $0.11 by April 2026 Amid Neutral Technical Signals

James Ding Mar 16, 2026 10:25

HBAR price prediction shows consolidation around $0.10 with potential upside to $0.11 in April. Technical indicators remain neutral as Hedera faces key resistance levels.

HBAR Price Prediction: Targets $0.11 by April 2026 Amid Neutral Technical Signals

HBAR Price Prediction Summary

Short-term target (1 week): $0.095-$0.105 • Medium-term forecast (1 month): $0.09-$0.11 range • Bullish breakout level: $0.105 • Critical support: $0.095

What Crypto Analysts Are Saying About Hedera

While specific analyst predictions from key opinion leaders are limited in recent days, historical forecasts from January 2026 showed optimism for HBAR. According to Blockchain.News and TheCryptoSteer from January 5, 2026, analysts were targeting $0.16 for HBAR during that period. However, the token has since consolidated significantly lower around current levels.

On-chain metrics suggest Hedera continues to maintain steady network activity, though price action has been range-bound. The absence of fresh analyst commentary indicates the market may be waiting for clearer directional signals before major position adjustments.

HBAR Technical Analysis Breakdown

Hedera's current technical picture presents a neutral to slightly bearish setup. The RSI reading of 52.25 places HBAR firmly in neutral territory, suggesting neither overbought nor oversold conditions. This balanced momentum indicator leaves room for movement in either direction.

The MACD analysis reveals concerning signals with the histogram at 0.0000, indicating bearish momentum despite the recent 1.07% daily gain. The MACD line at -0.0009 and signal line at -0.0009 show convergence near the zero line, suggesting potential for a momentum shift.

Bollinger Bands analysis shows HBAR positioned at 0.5714 between the upper ($0.10) and lower ($0.09) bands, with the middle band also at $0.10. This positioning indicates the token is trading slightly above the 20-day moving average but within normal volatility ranges.

Moving averages present a mixed picture, with shorter-term SMAs (7, 20, 50-day) all converging around $0.10, while the 200-day SMA sits significantly higher at $0.15, indicating the long-term trend remains bearish from higher levels.

Hedera Price Targets: Bull vs Bear Case

Bullish Scenario

In a bullish outcome, HBAR price prediction points to an initial target of $0.105, representing the immediate resistance level. A break above this level could trigger momentum toward $0.11, which would represent approximately 10% upside from current levels.

For this bullish scenario to unfold, HBAR would need to see RSI push above 60, indicating stronger buying momentum, and the MACD histogram to turn decisively positive. Volume confirmation above the recent 24-hour average of $14.9 million would also be crucial.

The Hedera forecast becomes more optimistic if the token can reclaim its 200-day moving average at $0.15, though this represents a 50% move from current levels and would require significant fundamental catalysts.

Bearish Scenario

The bearish case for HBAR centers around the $0.095 support level. A breakdown below this key level could trigger selling toward $0.09, representing the lower Bollinger Band and a potential 10% decline.

Technical confirmation of bearish momentum would come from RSI dropping below 40 and the MACD histogram turning more negative. The current MACD bearish signal already suggests downward pressure may intensify.

In an extreme bearish scenario, HBAR could test levels closer to $0.08, representing a retest of previous significant support zones established during earlier market cycles.

Should You Buy HBAR? Entry Strategy

For potential HBAR buyers, the current technical setup suggests a wait-and-see approach. The neutral RSI and mixed moving average signals indicate the token is in a consolidation phase rather than a clear trending environment.

Conservative entry points would be on any pullback toward $0.095 support, with a stop-loss positioned below $0.09. This provides a risk-to-reward ratio that favors upside targets near $0.105-$0.11.

More aggressive traders might consider current levels around $0.10, but should maintain tight risk management with stops below $0.095. Position sizing should account for the token's daily ATR and recent volatility patterns.

Dollar-cost averaging could be appropriate for longer-term holders, given the significant gap between current prices and the 200-day moving average at $0.15.

Conclusion

The HBAR price prediction for the coming weeks suggests continued consolidation around current levels, with a slight bias toward testing $0.11 resistance if broader crypto markets remain supportive. The neutral technical indicators provide limited directional conviction, making risk management paramount for any position.

While historical analyst targets of $0.16 appear overly optimistic in the near term, the Hedera forecast remains cautiously positive for patient investors willing to accumulate during this consolidation phase. However, traders should remain aware that cryptocurrency predictions are inherently speculative, and past performance does not guarantee future results.

Disclaimer: This analysis is for informational purposes only and should not be considered financial advice. Cryptocurrency investments carry significant risk, and readers should conduct their own research before making investment decisions.
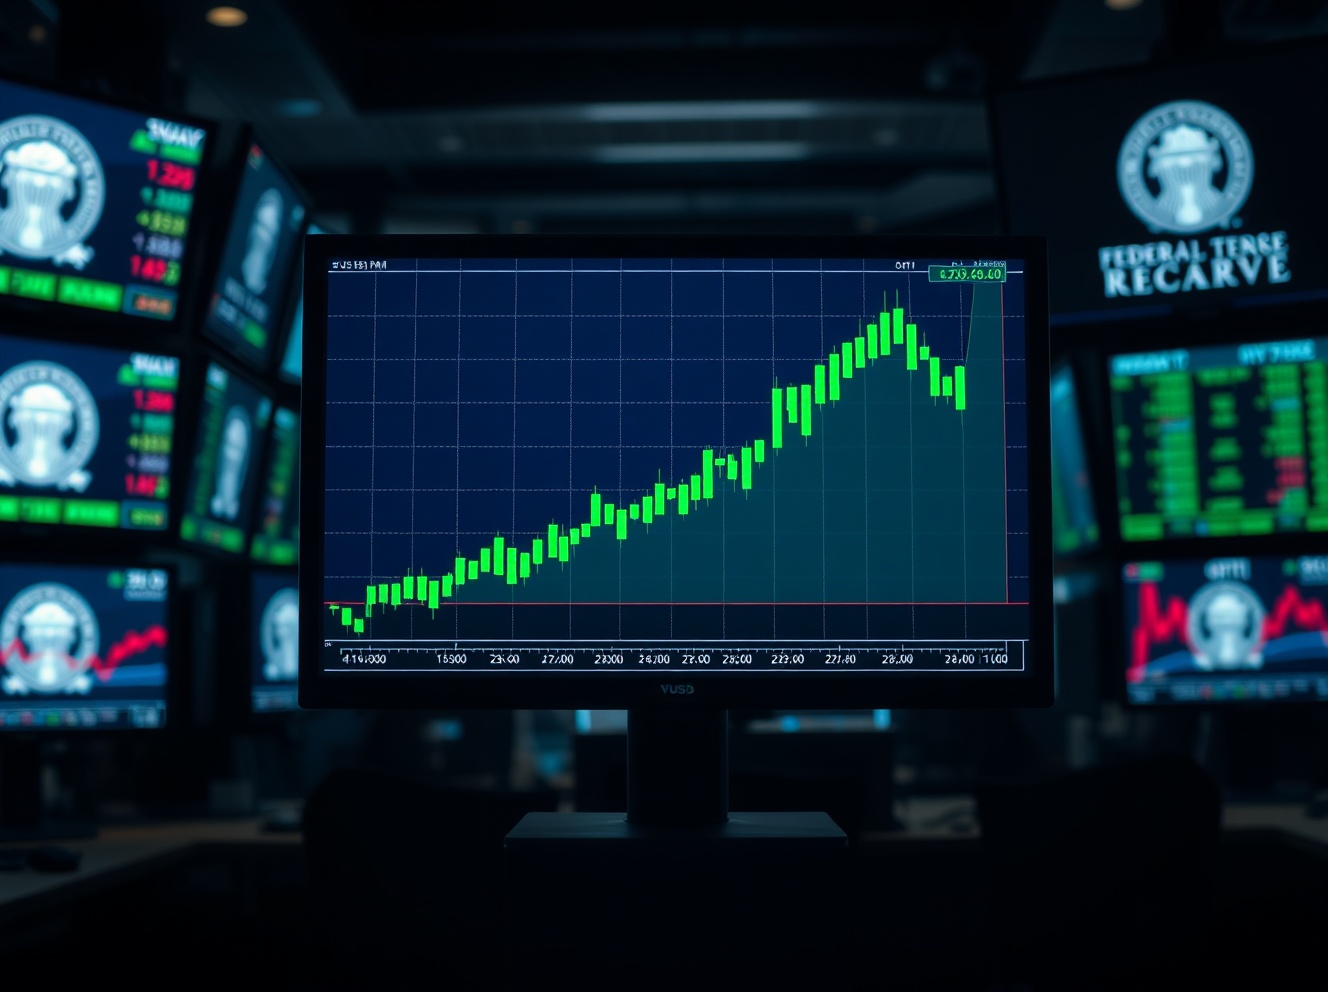
Image source: Shutterstock
  • hbar price analysis
  • hbar price prediction
Market Opportunity
Hedera Logo
Hedera Price(HBAR)
$0.09844
$0.09844$0.09844
+0.34%
USD
Hedera (HBAR) Live Price Chart
Disclaimer: The articles reposted on this site are sourced from public platforms and are provided for informational purposes only. They do not necessarily reflect the views of MEXC. All rights remain with the original authors. If you believe any content infringes on third-party rights, please contact crypto.news@mexc.com for removal. MEXC makes no guarantees regarding the accuracy, completeness, or timeliness of the content and is not responsible for any actions taken based on the information provided. The content does not constitute financial, legal, or other professional advice, nor should it be considered a recommendation or endorsement by MEXC.

You May Also Like

Fed forecasts only one rate cut in 2026, a more conservative outlook than expected

Fed forecasts only one rate cut in 2026, a more conservative outlook than expected

The post Fed forecasts only one rate cut in 2026, a more conservative outlook than expected appeared on BitcoinEthereumNews.com. Federal Reserve Chairman Jerome Powell talks to reporters following the regular Federal Open Market Committee meetings at the Fed on July 30, 2025 in Washington, DC. Chip Somodevilla | Getty Images The Federal Reserve is projecting only one rate cut in 2026, fewer than expected, according to its median projection. The central bank’s so-called dot plot, which shows 19 individual members’ expectations anonymously, indicated a median estimate of 3.4% for the federal funds rate at the end of 2026. That compares to a median estimate of 3.6% for the end of this year following two expected cuts on top of Wednesday’s reduction. A single quarter-point reduction next year is significantly more conservative than current market pricing. Traders are currently pricing in at two to three more rate cuts next year, according to the CME Group’s FedWatch tool, updated shortly after the decision. The gauge uses prices on 30-day fed funds futures contracts to determine market-implied odds for rate moves. Here are the Fed’s latest targets from 19 FOMC members, both voters and nonvoters: Zoom In IconArrows pointing outwards The forecasts, however, showed a large difference of opinion with two voting members seeing as many as four cuts. Three officials penciled in three rate reductions next year. “Next year’s dot plot is a mosaic of different perspectives and is an accurate reflection of a confusing economic outlook, muddied by labor supply shifts, data measurement concerns, and government policy upheaval and uncertainty,” said Seema Shah, chief global strategist at Principal Asset Management. The central bank has two policy meetings left for the year, one in October and one in December. Economic projections from the Fed saw slightly faster economic growth in 2026 than was projected in June, while the outlook for inflation was updated modestly higher for next year. There’s a lot of uncertainty…
Share
BitcoinEthereumNews2025/09/18 02:59
Whales Dump 200 Million XRP in Just 2 Weeks – Is XRP’s Price on the Verge of Collapse?

Whales Dump 200 Million XRP in Just 2 Weeks – Is XRP’s Price on the Verge of Collapse?

Whales offload 200 million XRP leaving market uncertainty behind. XRP faces potential collapse as whales drive major price shifts. Is XRP’s future in danger after massive sell-off by whales? XRP’s price has been under intense pressure recently as whales reportedly offloaded a staggering 200 million XRP over the past two weeks. This massive sell-off has raised alarms across the cryptocurrency community, as many wonder if the market is on the brink of collapse or just undergoing a temporary correction. According to crypto analyst Ali (@ali_charts), this surge in whale activity correlates directly with the price fluctuations seen in the past few weeks. XRP experienced a sharp spike in late July and early August, but the price quickly reversed as whales began to sell their holdings in large quantities. The increased volume during this period highlights the intensity of the sell-off, leaving many traders to question the future of XRP’s value. Whales have offloaded around 200 million $XRP in the last two weeks! pic.twitter.com/MiSQPpDwZM — Ali (@ali_charts) September 17, 2025 Also Read: Shiba Inu’s Price Is at a Tipping Point: Will It Break or Crash Soon? Can XRP Recover or Is a Bigger Decline Ahead? As the market absorbs the effects of the whale offload, technical indicators suggest that XRP may be facing a period of consolidation. The Relative Strength Index (RSI), currently sitting at 53.05, signals a neutral market stance, indicating that XRP could move in either direction. This leaves traders uncertain whether the XRP will break above its current resistance levels or continue to fall as more whales sell off their holdings. Source: Tradingview Additionally, the Bollinger Bands, suggest that XRP is nearing the upper limits of its range. This often points to a potential slowdown or pullback in price, further raising concerns about the future direction of the XRP. With the price currently around $3.02, many are questioning whether XRP can regain its footing or if it will continue to decline. The Aftermath of Whale Activity: Is XRP’s Future in Danger? Despite the large sell-off, XRP is not yet showing signs of total collapse. However, the market remains fragile, and the price is likely to remain volatile in the coming days. With whales continuing to influence price movements, many investors are watching closely to see if this trend will reverse or intensify. The coming weeks will be critical for determining whether XRP can stabilize or face further declines. The combination of whale offloading and technical indicators suggest that XRP’s price is at a crossroads. Traders and investors alike are waiting for clear signals to determine if the XRP will bounce back or continue its downward trajectory. Also Read: Metaplanet’s Bold Move: $15M U.S. Subsidiary to Supercharge Bitcoin Strategy The post Whales Dump 200 Million XRP in Just 2 Weeks – Is XRP’s Price on the Verge of Collapse? appeared first on 36Crypto.
Share
Coinstats2025/09/17 23:42
Wall Street expert predicts 80% Tesla stock crash in 2026

Wall Street expert predicts 80% Tesla stock crash in 2026

The post Wall Street expert predicts 80% Tesla stock crash in 2026 appeared on BitcoinEthereumNews.com. Tesla (NASDAQ: TSLA) FSD – the autonomous driving technology
Share
BitcoinEthereumNews2026/03/16 22:04