

Shiba Inu (SHIB) Shows Warning Signs as Price Hints at Another Dip
Shiba Inu price has returned to a delicate zone after several failed attempts to push higher. Recent price action shows SHIB struggling to break above a descending resistance line. That pattern has started raising concerns about another short-term decline.
Market observers began paying closer attention after a technical breakdown shared by MyCryptoParadise circulated through crypto analysis channels. The commentary appeared through a post highlighted by The CryptoBasic and described a structure that could push SHIB price toward lower support levels if resistance continues to hold.
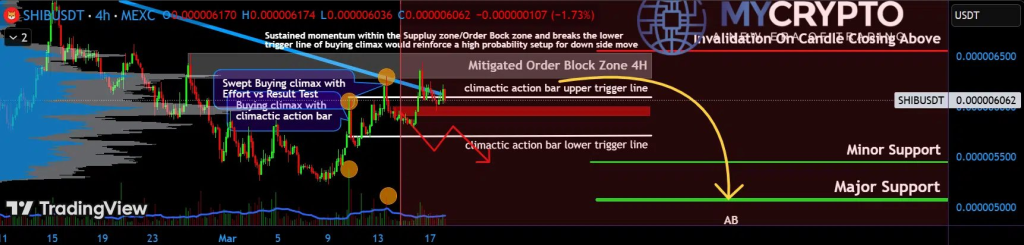
A look at the SHIB chart reveals a descending resistance line that has controlled price action for several sessions. Every attempt by Shiba Inu to climb above that barrier has resulted in rejection.
The chart shows a supply zone where earlier buying pressure reached exhaustion. Technical notes on the image describe a swept buying climax and a climactic action bar near the resistance region. Such behavior often appears near the top of short term rallies.
Price moved back toward that resistance area again. The market failed to break above the upper trigger line associated with the order block zone. That repeated rejection left SHIB price trapped under the descending trendline.
MyCryptoParadise explained that the broader structure still leans bearish when zoomed out. As long as SHIB remains below the trendline, recovery attempts face strong resistance overhead.
 @thecryptobasic / X
Short Term SHIB Price Structure Points Toward A Potential Pullback
The chart also marks a red order block zone above the current SHIB price. That zone represents an area where selling pressure previously dominated.
Technical analysis shared by MyCryptoParadise indicates that the current structure could produce a correction toward the nearest support area. The first downside objective sits close to $0.00000545.
That level represents the minor support region shown on the chart. Price has previously reacted there during earlier consolidation phases.
Market structures like this often test nearby support zones after repeated rejection at resistance. The projected move would represent a correction of roughly 10.5% from recent price levels.
A break of that minor support would shift attention to a deeper demand area. The chart identifies a stronger support region close to $0.00000507.
Major SHIB Support Around $0.00000507 Could Become A Key Decision Zone
The lower support area marked on the chart stands out as the major demand zone for Shiba Inu. Buyers previously stepped into that region during earlier declines.
MyCryptoParadise pointed to that zone as the most important level if the current correction continues. Price reaching that area would test whether buyers remain willing to defend the market.
Read Also: How Much Could $2,000 in Stellar (XLM) Be Worth By 2027?
Technical structures often stabilize at such zones after distribution patterns appear near resistance. The large yellow projection arrow on the chart outlines the potential path toward that demand level.
Another outcome remains possible if market conditions change. SHIB price moving above the resistance band near $0.00000656 would challenge the bearish outlook described in the analysis.
Subscribe to our YouTube channel for daily crypto updates, market insights, and expert analysis.
The post Shiba Inu (SHIB) Shows Warning Signs as Price Hints at Another Dip appeared first on CaptainAltcoin.


You May Also Like

Senate Confirms Bitcoin-Friendly Kevin Warsh to Fed Board, Clearing Path to Chairmanship
Senate Moves to Approve Kevin Warsh for Fed Chair Role


