

Here’s Why the Crypto Market Is Crashing as the Bitcoin Price Nears $70K Again
The total crypto market cap just fell 4.13% to $2.44 trillion in the last 24 hours. Derivatives volume dropped 17.51%. Bitcoin liquidations surged 140.22% to $150.85 million, mostly long positions getting wiped out.
Yet in the middle of all this red, U.S. spot Bitcoin ETF AUM grew to $100.05 billion, adding roughly $3 billion in a single day.
This is the confusing reality of crypto right now. Falling prices, low volume, and leveraged long liquidations point to selling pressure and weak momentum. But steady ETF inflows suggest institutional accumulation that could put a floor under price.
Here’s what’s actually happening.
Bitcoin-Led Macro Sell-Off
Bitcoin led this decline. With dominance at 58.23%, Bitcoin’s drop contributed most of the total market cap loss. And this move correlated strongly with declines in the S&P 500 and Gold. Right now, the BTC price is trading slightly above $70K.
That’s key. This is a unified macro reaction.
Crypto is acting as a high-beta risk asset, highly sensitive to traditional market liquidity and inflation expectations. When traditional markets sneeze, crypto catches a cold.
The level to watch is $71,000. If Bitcoin can stabilize above that, broader market losses may stem. If not, more downside could follow.
Leverage Unwind and Fear Sentiment
The sell-off got worse because leveraged longs got forced out. BTC liquidations jumped 140% in 24 hours. This technical squeeze happened alongside a Fear & Greed Index reading of 33, reflecting widespread caution.
High leverage in the system acted like gasoline on a fire. A moderate correction turned sharper as automatic sell orders triggered.
Watch for funding rates to normalize and liquidation volumes to drop. That signals forced selling pressure is ending.
What Comes Next, According to CryptoCon
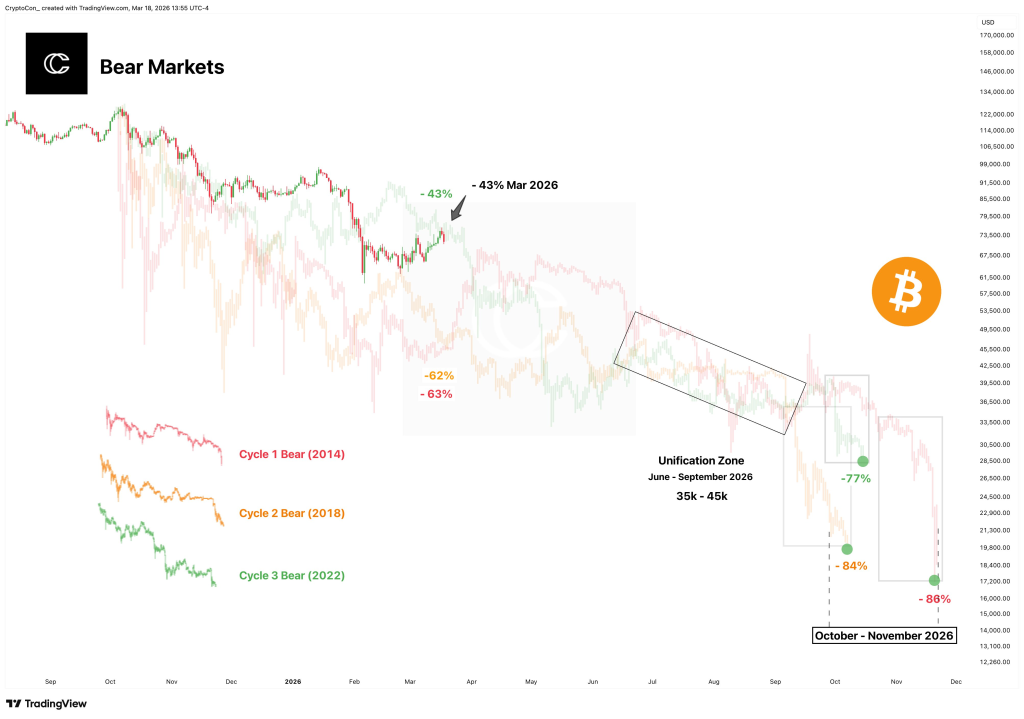
Analyst CryptoCon shared a chart showing where Bitcoin fits in historical bear market patterns. The current drawdown now lines up with last cycle’s 2022 bear market after a brief period of worse performance.
Looking at previous cycles, the pattern is clear. Cycle 1 bear in 2014. Cycle 2 bear in 2018. Cycle 3 bear in 2022. Each followed similar trajectories.
According to CryptoCon, the most likely next step is a decline to $45,000 and eventually $35,000. That’s where drawdowns from different cycles unify in a zone he calls the “Unification Zone” from June to September 2026.
“That’s not unlikely given the room most indicators have to go before bottoming out, and bottom support metrics which line up in that zone (35k – 45k),” he notes.
 Source: X/@CryptoCon_
His chart shows this zone marked clearly. A move to $35,000 would represent an 86% drawdown from highs, aligning with previous cycle bottoms. The $45,000 level sits at a 77% drawdown.
“It’s the last drop that does most of the damage, which has been the part that decreases every cycle. It will be interesting to see what happens then! (October – November of this year).”
Short-term, the market faces selling pressure, leverage unwinding, and macro headwinds. But long-term, the infrastructure for institutional inflow looks solid.
For traders, the next few months could be choppy. For accumulators, lower prices might be an opportunity. Either way, the $35,000 to $45,000 zone is one to watch.
Subscribe to our YouTube channel for daily crypto updates, market insights, and expert analysis.
The post Here’s Why the Crypto Market Is Crashing as the Bitcoin Price Nears $70K Again appeared first on CaptainAltcoin.


You May Also Like

Crypto Hack: Drift Protocol Drained Over $200M in Private Key Breach

WTI Crude Oil Climbs Toward $96 as Supply Fears Intensify


