

Bitcoin Technical Analysis: Major Resistance Zone Could Decide BTC’s Next Move
Bitcoin (BTC) is once again approaching a critical technical inflection point as price action tightens beneath a major resistance zone. After a strong recovery phase in recent months, BTC is now consolidating just below levels that have historically triggered heavy selling pressure.
This phase of consolidation is crucial. Markets often compress before a breakout, and the direction of that breakout—bullish or bearish—can define the next major trend. For traders, the current setup presents both opportunity and risk.
Current Market Structure
Bitcoin is currently trading within a horizontal consolidation range, forming a classic “range-bound” structure after a prior uptrend. This pattern typically signals a pause in momentum as buyers and sellers battle for control.
The price has been making higher lows, indicating underlying bullish strength. However, repeated rejections near resistance suggest that sellers remain active at higher levels.
This creates a tightening structure, often referred to as a volatility squeeze, which usually precedes a strong directional move.
Major Resistance Zone: The Key Decision Level
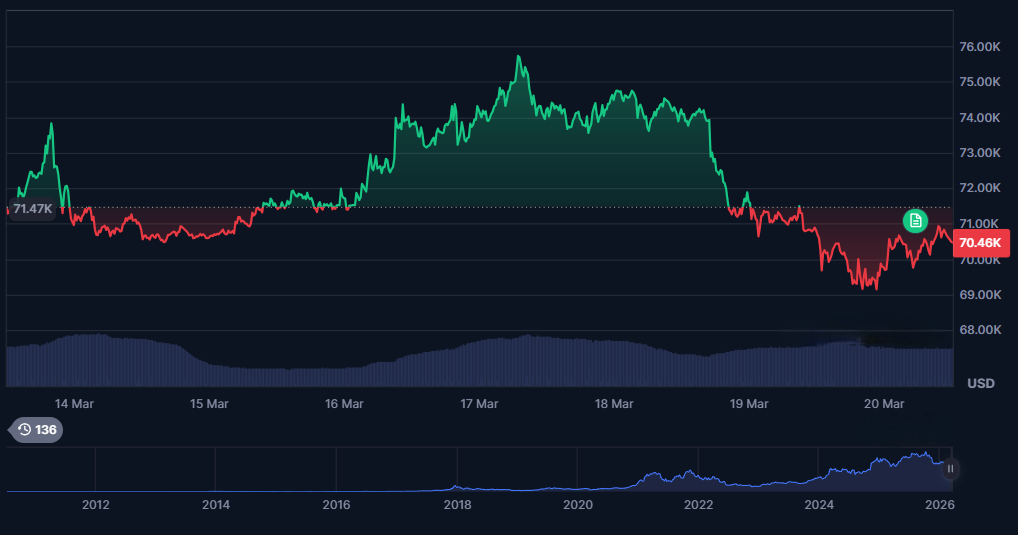
The most important technical level to watch is the major resistance zone between $68,000 and $72,000 (example range based on recent market structure).
This area has historically acted as:
- A previous distribution zone
- A profit-taking level for large investors
- A psychological barrier for traders
Repeated rejection from this zone suggests that significant selling pressure exists. However, each retest weakens resistance, increasing the probability of a breakout.
A confirmed breakout above this zone with strong volume could trigger a new bullish phase, potentially pushing BTC toward new highs.
Key Support Levels
While resistance defines the upside, support levels determine downside risk.
Immediate Support:
- $64,000: Short-term demand zone
Strong Support:
- $60,000: Major psychological and technical level
Critical Breakdown Level:
- $56,000: Loss of this level could shift the trend bearish
Holding above these levels is essential for maintaining bullish market structure. A breakdown below key support zones would invalidate the current upward bias.
Technical Indicators and Signals
Relative Strength Index (RSI)
The RSI on the daily and weekly timeframes is hovering near neutral levels (50–60 range). This indicates:
- No overbought conditions
- Room for further upside
- Balanced momentum between buyers and sellers
A move above 70 would signal strong bullish momentum, while a drop below 40 could indicate increasing bearish pressure.
Moving Averages
Bitcoin remains above its key moving averages, including the 50-day and 200-day moving averages, which are currently trending upward.
This alignment typically supports a bullish long-term outlook. However, the narrowing gap between price and these averages suggests that momentum is slowing.
Volume Analysis
Trading volume has declined during the consolidation phase. This is a classic sign of market compression.
Low volume environments often precede high-volatility breakouts, making the current setup particularly important.
A breakout accompanied by strong volume would provide confirmation of trend direction.
Market Drivers and Recent Developments
Several external factors are influencing Bitcoin’s current position.
Institutional Activity
Institutional demand remains a key driver of Bitcoin’s price. ETF inflows have played a major role in supporting recent rallies, while outflows have contributed to short-term corrections.
Fluctuations in institutional capital flows can significantly impact price momentum near key resistance levels.
Macroeconomic Conditions
Global economic factors such as interest rates, inflation, and geopolitical tensions continue to affect investor sentiment.
In risk-on environments, Bitcoin tends to perform well as investors seek high-growth assets. Conversely, risk-off sentiment can trigger sell-offs.
Market Sentiment and Liquidity
Crypto markets remain highly sensitive to liquidity conditions. Increased liquidity often drives bullish momentum, while tightening liquidity can lead to consolidation or decline.
Bullish Scenario
If Bitcoin successfully breaks above the $72,000 resistance zone, the following targets become likely:
- $75,000
- $80,000
- Potential new all-time highs
This scenario would likely be supported by strong volume, positive macro conditions, and continued institutional inflows.
Bearish Scenario
If Bitcoin fails to break resistance and loses key support levels, downside risks include:
- $60,000 retest
- $56,000 breakdown
- Deeper correction toward lower support zones
This outcome could be triggered by macroeconomic uncertainty or reduced institutional demand.
Final Outlook
Bitcoin is currently positioned at a critical decision point, where a major resistance zone could determine the next phase of the market cycle.
The overall structure remains cautiously bullish, supported by higher lows and strong long-term trends. However, resistance pressure and macro uncertainty continue to limit upward momentum.
For traders and investors, the key strategy is to monitor confirmation signals—particularly volume and breakout strength. The next move from this consolidation range is likely to be significant, making this one of the most important technical setups in the current crypto market.


You May Also Like

EUR/GBP Exchange Rate Surges as Bank of England Rate Hike Expectations Intensify – Market Analysis
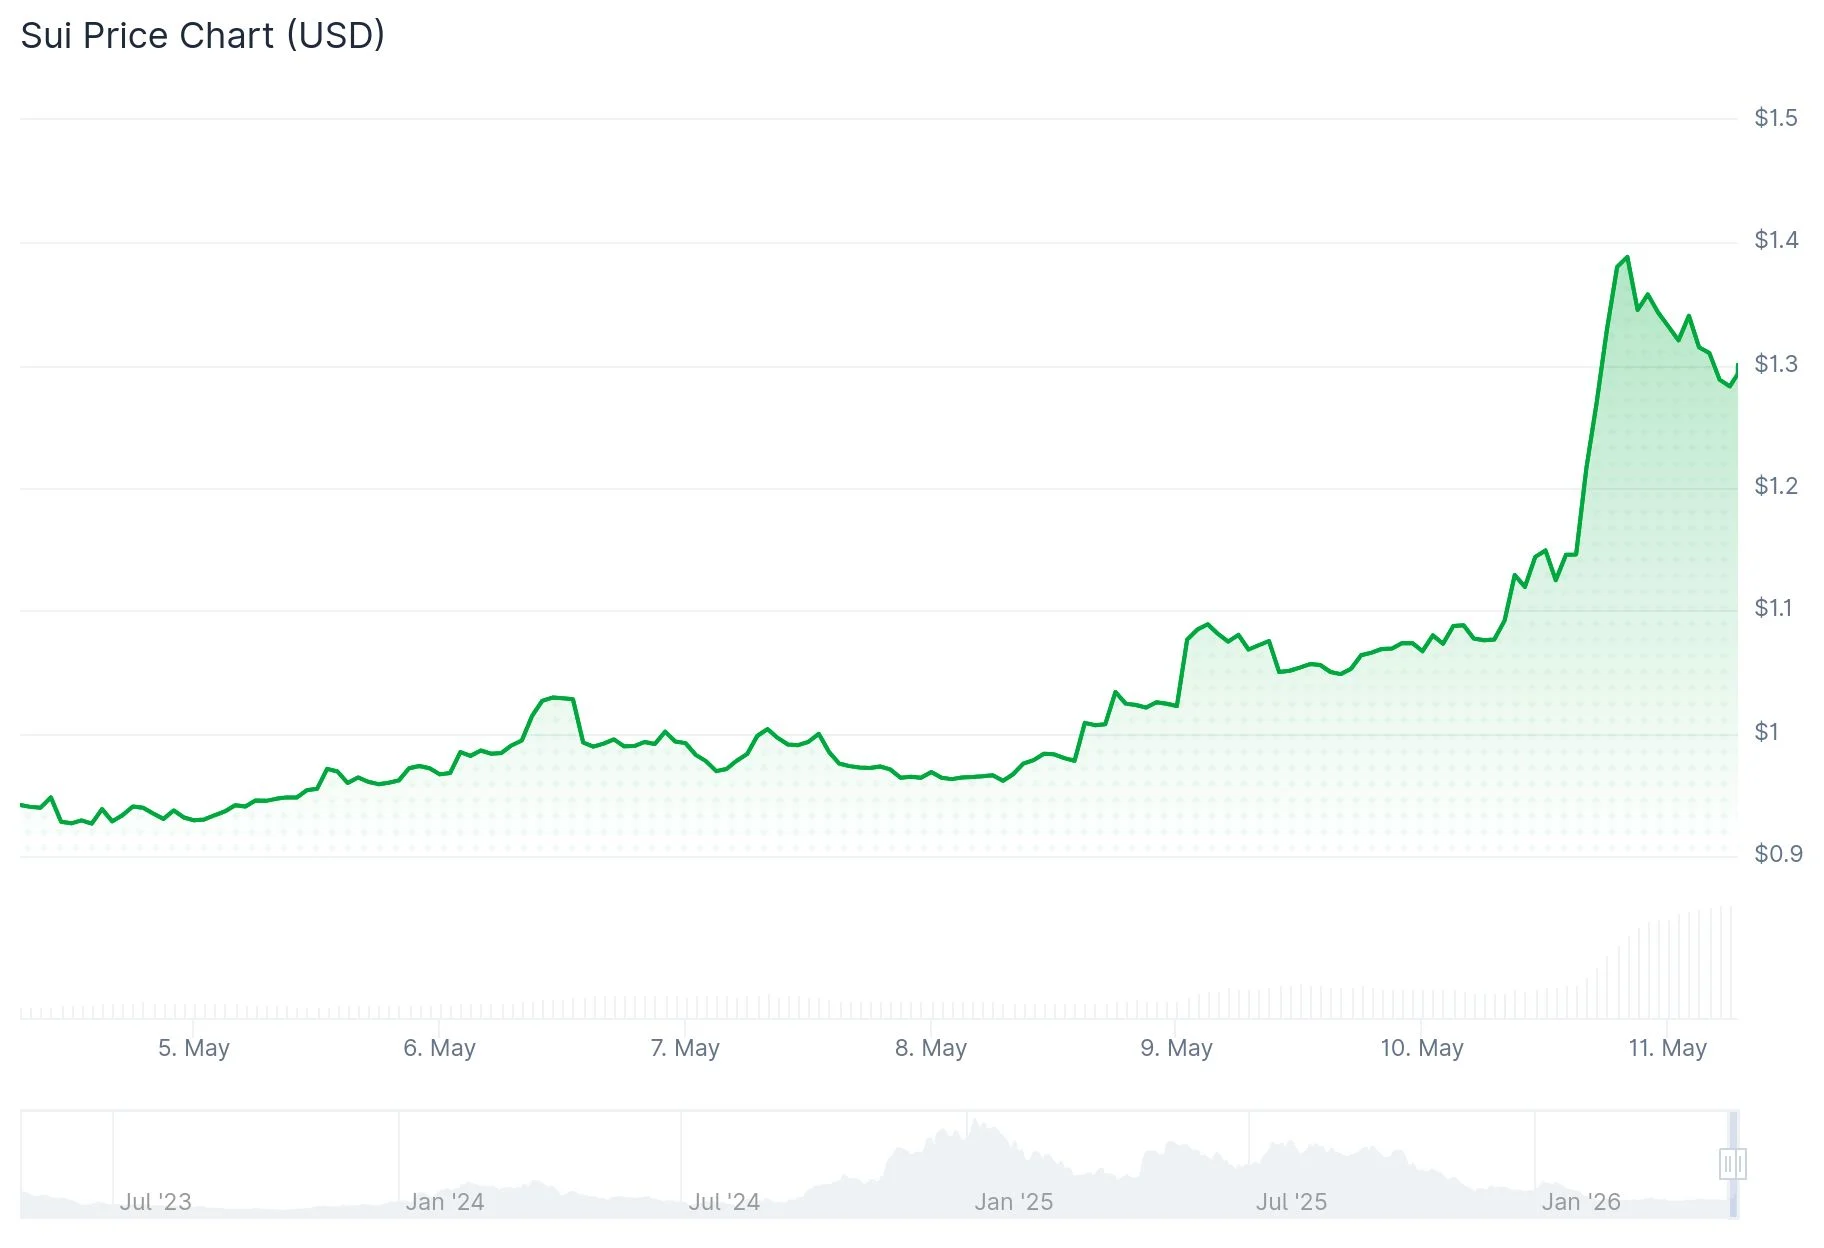
Sui (SUI) Token Rockets 50% Weekly on Institutional Staking and Privacy Tech Rollout


