XRP (XRP) Price Analysis: Could This 10% Correction Present a Strategic Entry Point?
Key Takeaways
- XRP has declined 10.5% across a three-day period but maintains position above a critical bull flag breakout zone between $1.40 and $1.45
- South Korean investors are removing XRP from Upbit at unprecedented rates, mirroring behavior seen during previous accumulation cycles
- Large holder net flows have flipped positive for the first time since the beginning of 2024, indicating potential shift from distribution to accumulation
- The March 18 Federal Reserve decision maintained rates at 3.5%–3.75%, creating headwinds for risk-on assets across cryptocurrency markets
- XRP spot ETF products in the United States reported no net capital inflows on Wednesday, though total cumulative inflows remain at $1.21 billion
XRP currently trades within the $1.42–$1.45 range following a steep three-day retracement exceeding 10%. This pullback occurred amid widespread cryptocurrency market volatility, yet multiple blockchain metrics suggest conditions may be developing for a reversal.
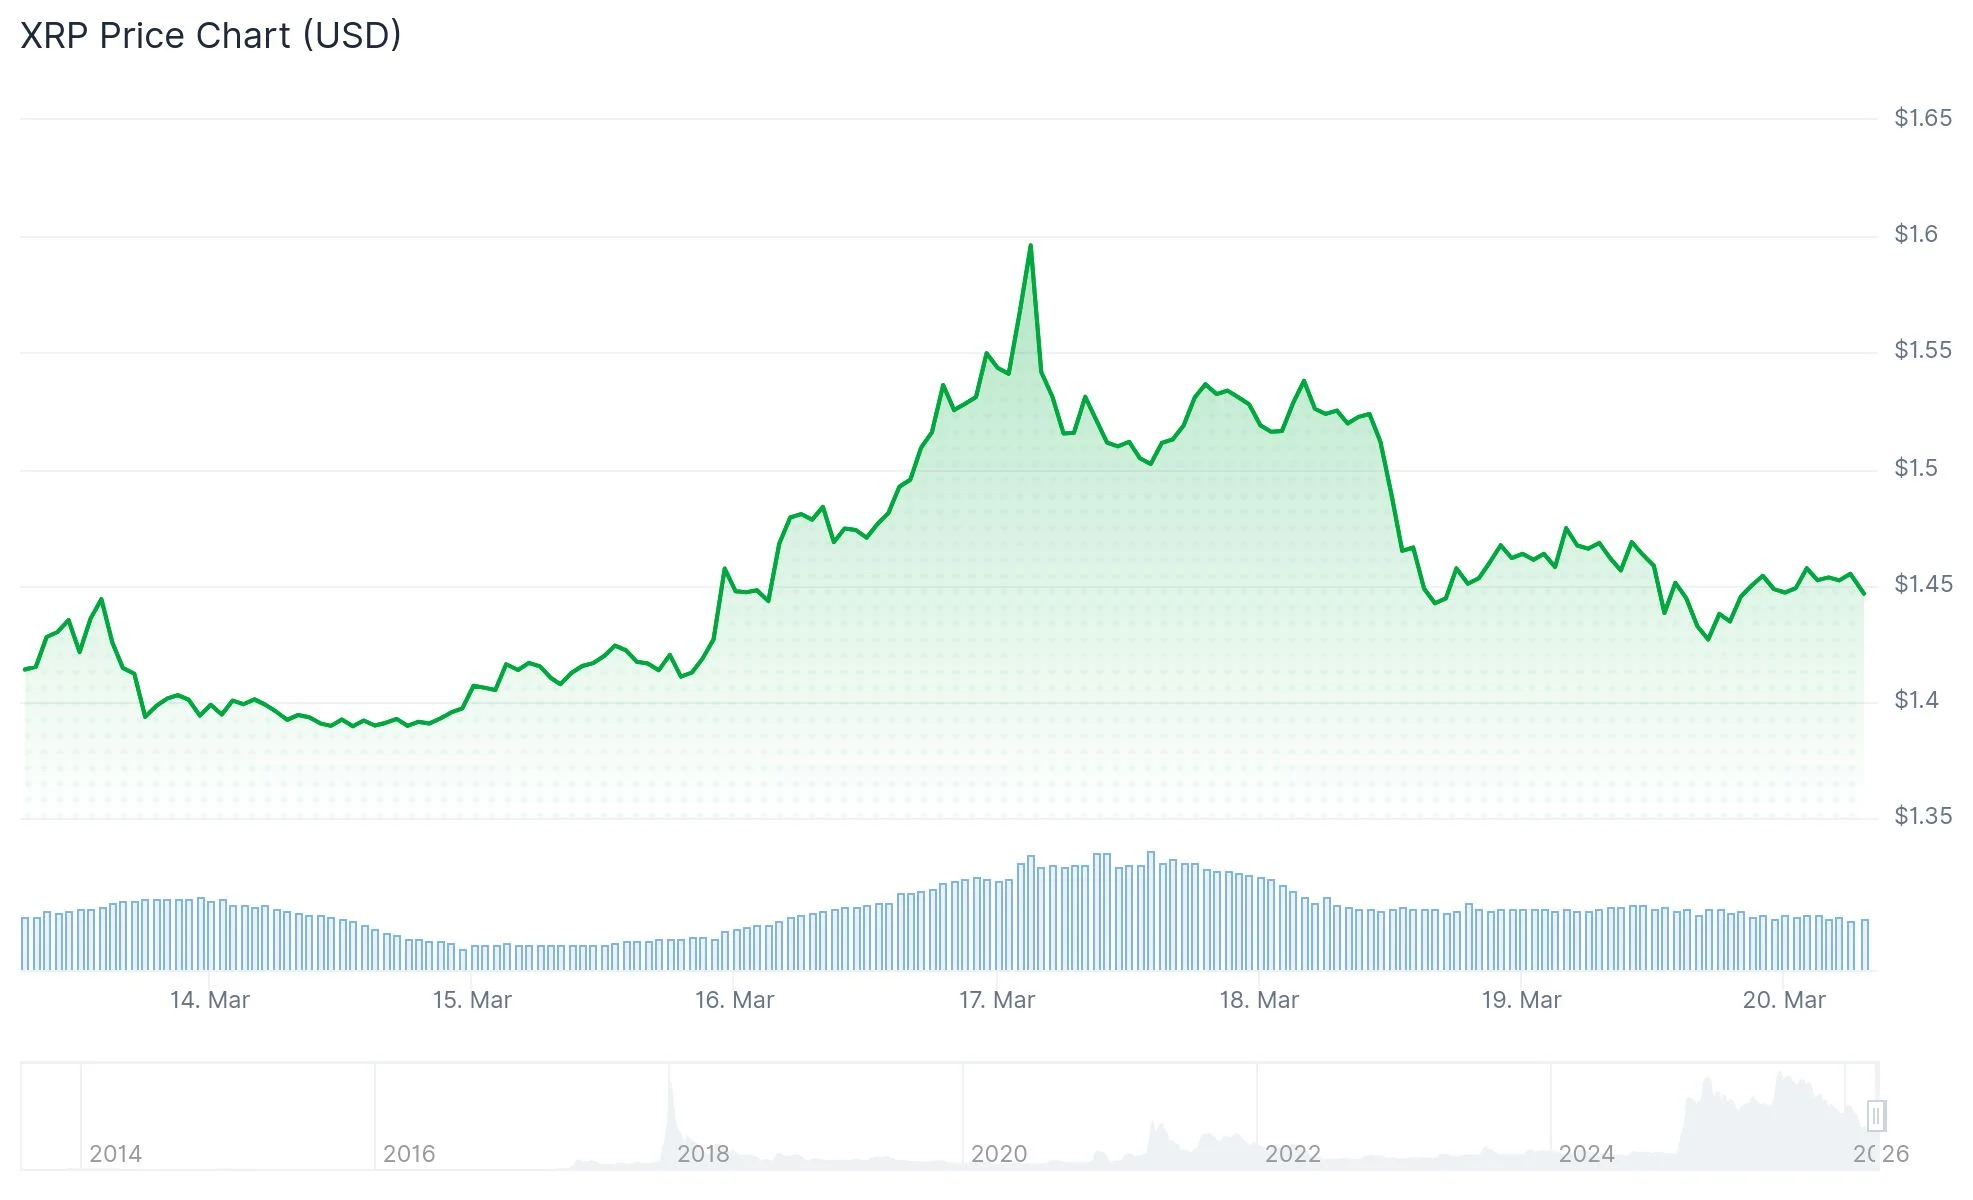 XRP Price
The recent price action follows last week’s breakout from a bull flag formation. In chart pattern analysis, bull flags develop when an asset consolidates within a descending channel following a significant upward move. After clearing the upper boundary of this channel, assets frequently retest the former resistance zone as newly established support — a scenario that appears to be unfolding currently.
The critical support region resides in the mid-$1.40 area, which aligns with the 20-day exponential moving average. Should XRP maintain levels above this threshold, the bull flag’s projected upside target reaches approximately $1.70–$1.72, representing roughly 20% upside potential from present levels.
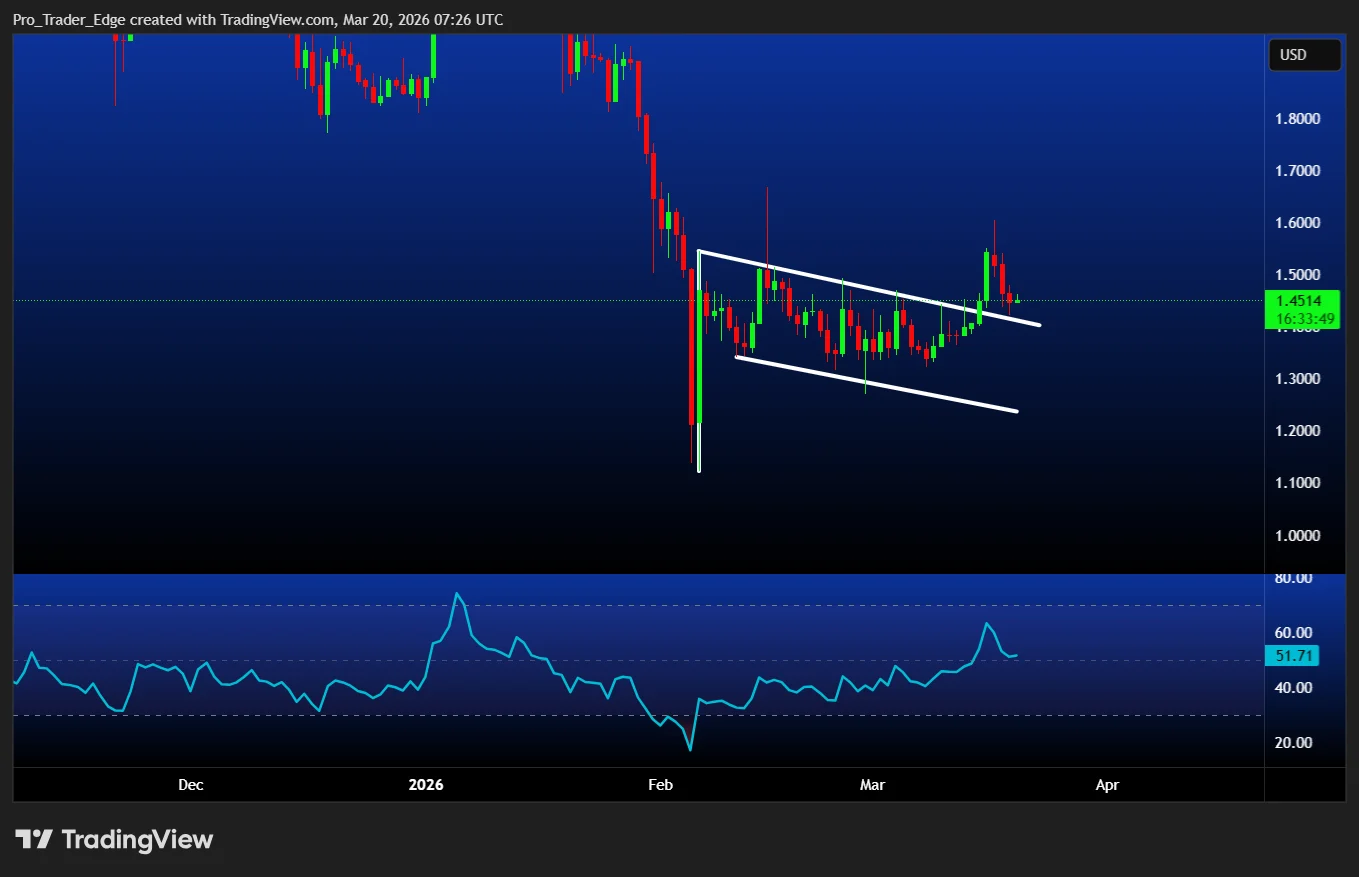 Source: TradingView
South Korean Exchange Withdrawals Reach Historic Highs
Blockchain intelligence from CryptoQuant reveals significant XRP withdrawal activity from South Korea’s Upbit platform beginning in December 2025. Wallet holders across virtually every size category have been removing XRP from the exchange at unprecedented volumes. Reduced exchange balances generally indicate diminished immediate selling pressure.
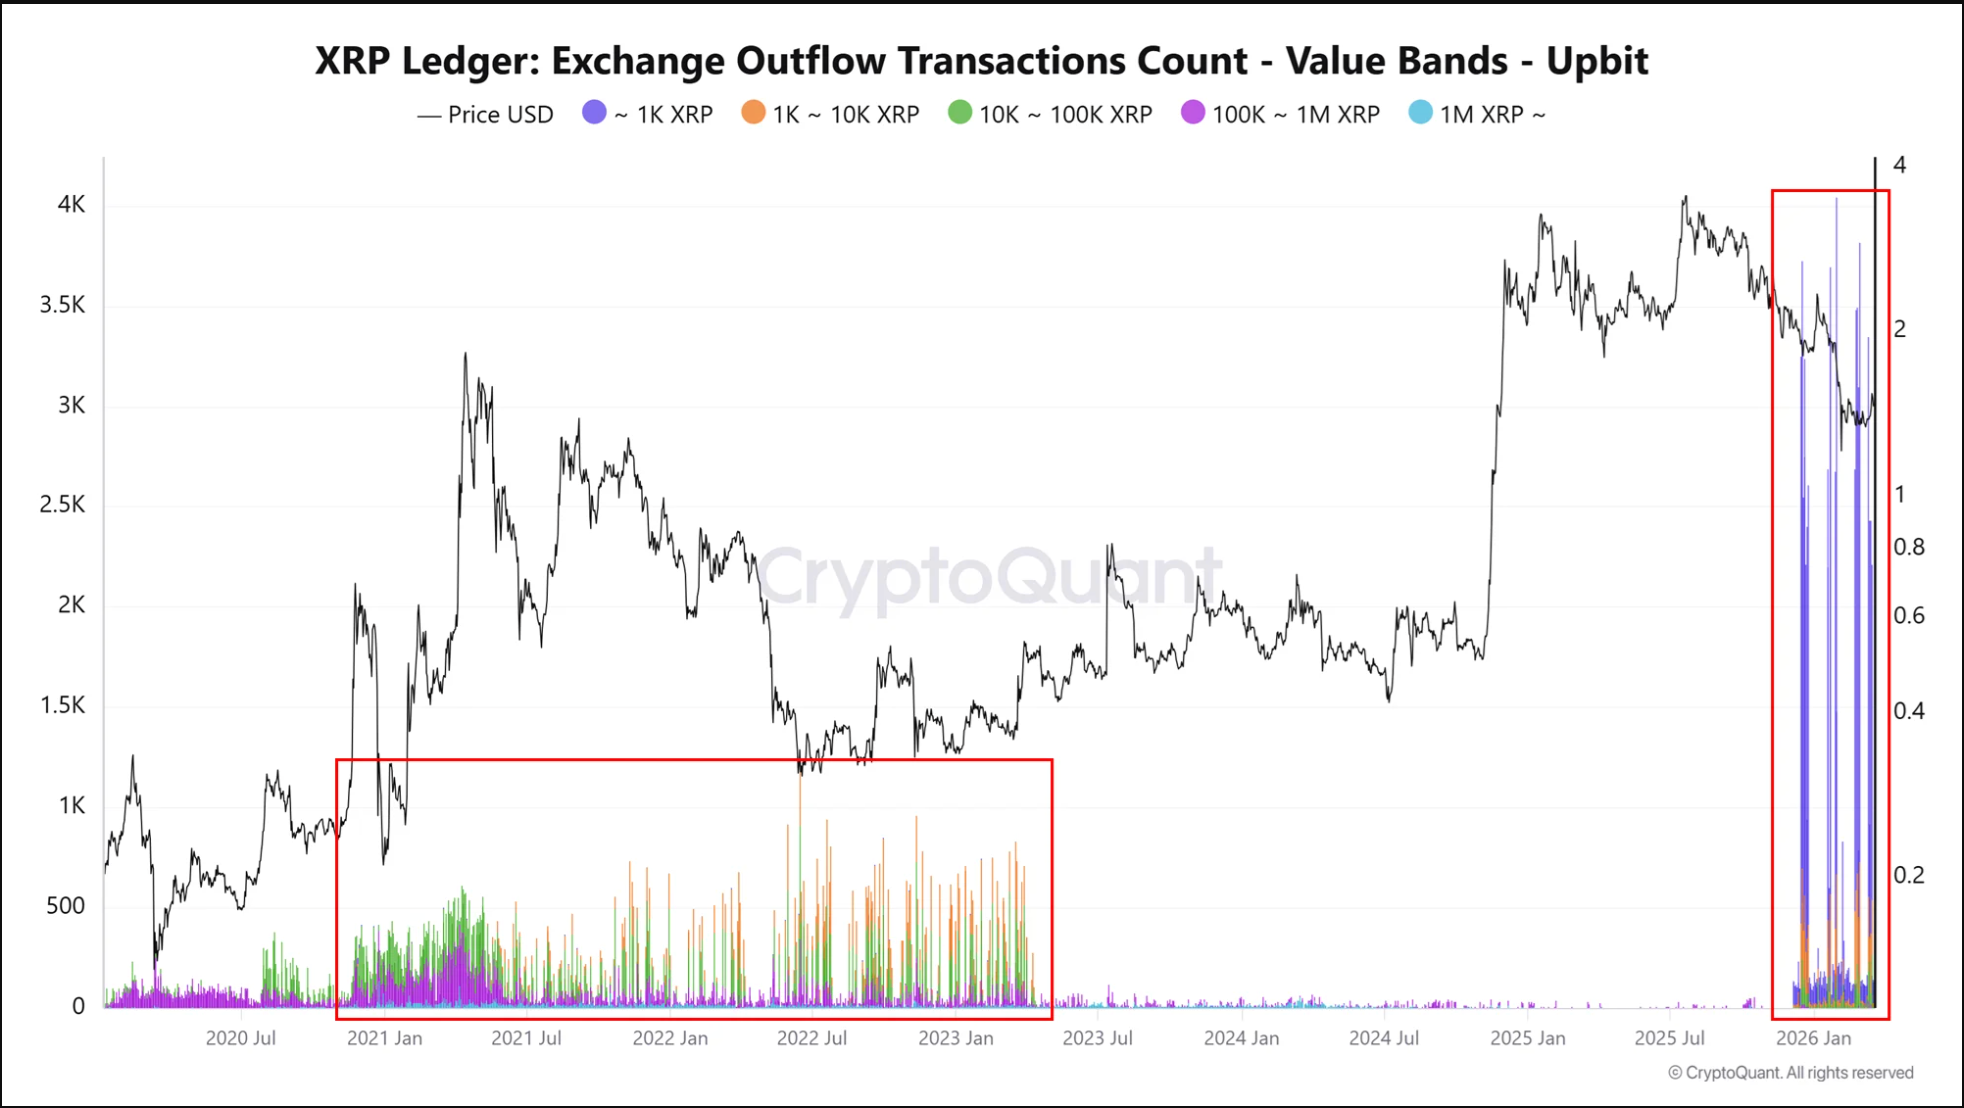 Source: CryptoQuant
CryptoQuant analyst CW identified comparable withdrawal patterns between 2021 and early 2023, when heightened Korean exchange outflows aligned with an accumulation phase. This period preceded XRP’s substantial rally from under $1 to above $3 — representing approximately 500% gains.
As of Thursday, XRP trading pairs denominated in South Korean Won ranked as the fourth-largest market by 24-hour trading volume according to CoinMarketCap data.
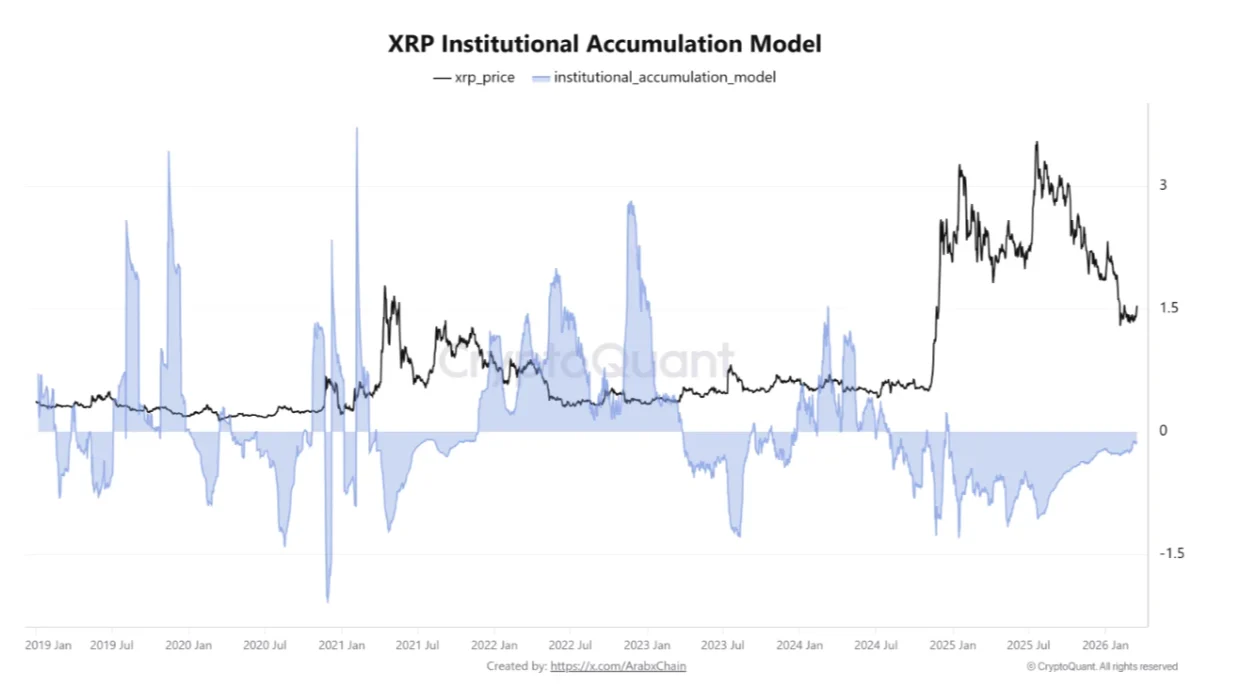
Large Holder Behavior Shows Notable Reversal
XRP’s 90-day moving average for whale-sized transactions has registered positive territory for the first time following an extended negative period throughout 2024 and into early 2025. During the negative phase, substantial holders were engaged in consistent selling activity. This recent reversal indicates that heavy distribution pressure may be subsiding.
A comparable transition took place during the April–September 2025 timeframe, when XRP advanced from approximately $2.20 to $3.55.
Regarding macroeconomic developments, the Federal Reserve maintained its benchmark interest rate at 3.5%–3.75% during the March 18 policy meeting, referencing persistent inflation concerns and geopolitical uncertainty. Financial markets interpreted this stance as restrictive policy continuation. The CMC Crypto Fear and Greed Index registered 29 at the time of analysis, reflecting heightened market anxiety.
Institutional engagement remains limited. US-listed XRP spot exchange-traded funds recorded zero net capital inflows on Wednesday. Total assets under management currently stand at approximately $1.02 billion, compared to cumulative net inflows of $1.21 billion.
 Source: CryptoQuant
Based on CoinGlass liquidation mapping data, significant liquidity concentration exists around the $1.35 price level. A breakdown beneath current support could activate cascading forced liquidations within that zone.
Examining the four-hour timeframe, XRP displayed a bearish MACD indicator crossover near the $1.54 resistance threshold. For bullish momentum to rebuild, a recapture of the $1.50 level would be necessary, with $1.55 representing the subsequent key resistance before any potential advance toward $1.60.
The post XRP (XRP) Price Analysis: Could This 10% Correction Present a Strategic Entry Point? appeared first on Blockonomi.


You May Also Like
Kraken Seeks Federal Banking Charter to Expand Crypto Custody Services
ONDO Price Prediction: Active Addresses Jump 300% Amid Strong Bullish Momentum