

Institutions Load Up on $1.6B Bitcoin as Rare Bullish Signal Returns Again
Bitcoin pushed toward $76,000 earlier this week before pulling back close to $70,700, and that sharp reversal has created a mix of caution and opportunity across the market. Price action between March 13 and March 20 shows a clear pattern. Strength early in the week gave way to a mid-week correction after the Federal Reserve update, and BTC now sits around a key psychological level near $70,000.
That short-term weakness has not stopped larger players from adding exposure. Crypto Patel explains that public companies bought about 23,090 BTC worth roughly $1.61 billion during this same period. The analyst said this type of accumulation often appears during uncertain moments, which makes it worth paying attention to.
The current Bitcoin setup looks mixed on the surface. Price failed to hold above $76,000 and slipped back toward support, which usually raises concern about further downside.
Crypto Patel pointed out that several companies added to their Bitcoin holdings during this decline. Strategy alone purchased over 22,000 BTC near $70,000, pushing its total holdings above 760,000 BTC. Other firms such as Strive Asset Management and American Bitcoin Corp also increased their exposure during the same window.
That pattern shows something important about market structure. Large buyers tend to step in during periods of weakness, especially when price returns to key levels. This behavior often creates a foundation that supports future moves once selling pressure fades.
Bullish Cross Indicator Has Historically Marked Start Of Major Bitcoin Runs
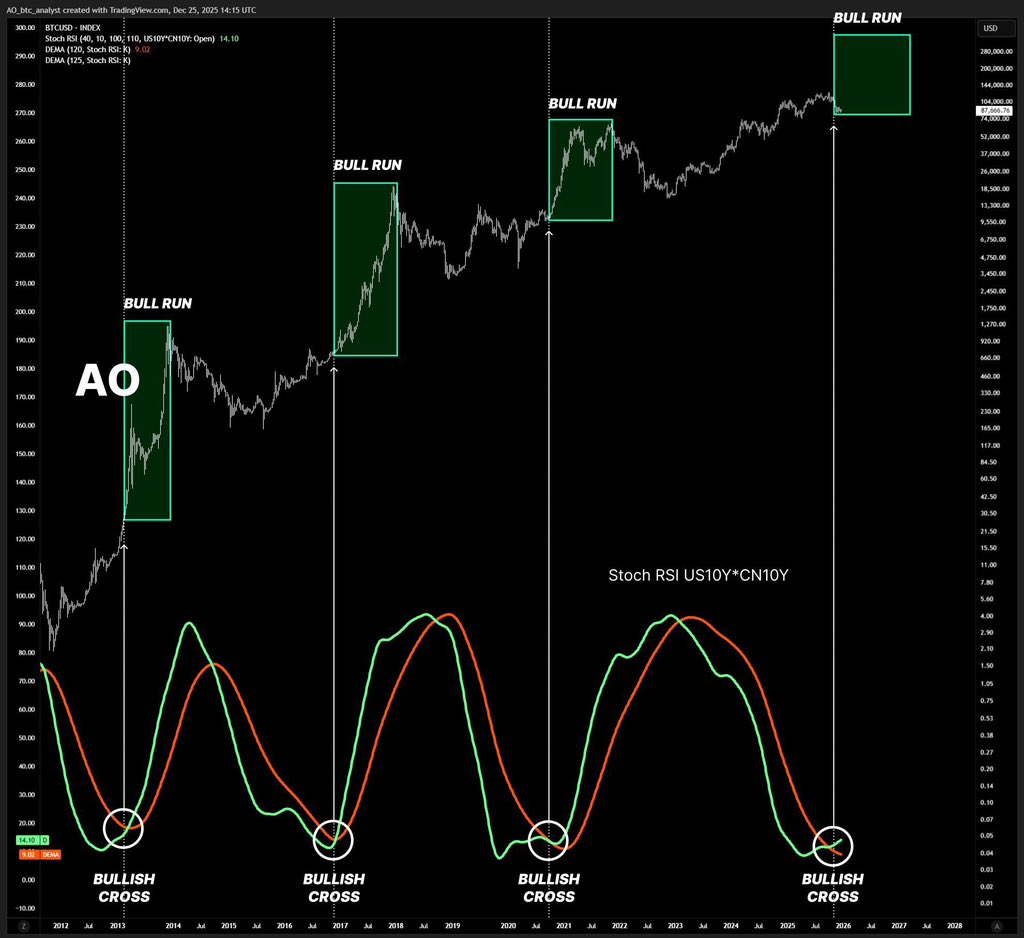
Another factor deserves attention, and it comes from a long term indicator shown in the chart above. Trending Bitcoin highlights a recurring pattern where a bullish cross on the stochastic RSI aligns with the early phase of major bull cycles.
A look at the chart shows three clear historical moments. The first appeared around 2012 before Bitcoin moved from about $15 to $1,000. The second showed up in 2016 before the run toward $20,000. The third occurred in 2020 before Bitcoin reached $69,000.
 @TrendingBitcoin / X
The indicator works by tracking momentum shifts at macro levels. When the faster line crosses above the slower line near the lower range, it signals that selling pressure may be fading and accumulation could begin.
The current chart shows that same bullish cross forming again. That similarity to past cycles explains why this signal draws attention, especially when it appears alongside institutional buying.
Historical Bitcoin Cycles Show Similar Setups Before Strong Expansions
Historical patterns also offer clues about what may follow. Each previous bullish cross happened after a period of consolidation and uncertainty. Price action looked unclear at the time, and sentiment often leaned cautious.
Bitcoin then entered a phase where higher highs followed over the next months. Those moves did not happen immediately, though they built over time as liquidity increased and confidence returned.
The current setup shares some of those characteristics. Price pulled back after a strong move, yet large buyers continue to accumulate. The presence of both elements creates a structure that has appeared before major expansions.
Read Also: How Much Could 7,915 XRP Tokens Be Worth by 2027?
The next phase depends on how Bitcoin reacts around the $70,000 level. A strong hold at this support could allow price to stabilize before another attempt higher. A break below may open the door for a deeper pullback before any recovery begins.
The bullish cross indicator adds another dimension to this outlook. It does not guarantee immediate upside, though it points to a shift in momentum that has aligned with past cycle transitions.
Crypto Patel mentions that institutional accumulation during weak price action often plays a role in those transitions. That combination of steady buying and improving momentum creates conditions that have supported previous bull runs.
Subscribe to our YouTube channel for daily crypto updates, market insights, and expert analysis.
The post Institutions Load Up on $1.6B Bitcoin as Rare Bullish Signal Returns Again appeared first on CaptainAltcoin.


You May Also Like

The Chemistry of UV Resistance: How Titanium Dioxide Protects Against the California Sun

Silver Price Surges Past $81.50 as Industrial Demand Strengthens


