Ethereum Today Crypto: ETHUSDT Caught Between Recovery and Macro Fear

Market conditions around Ethereum today crypto show a fragile balance between a tentative technical recovery and a broader backdrop of macro-driven fear.
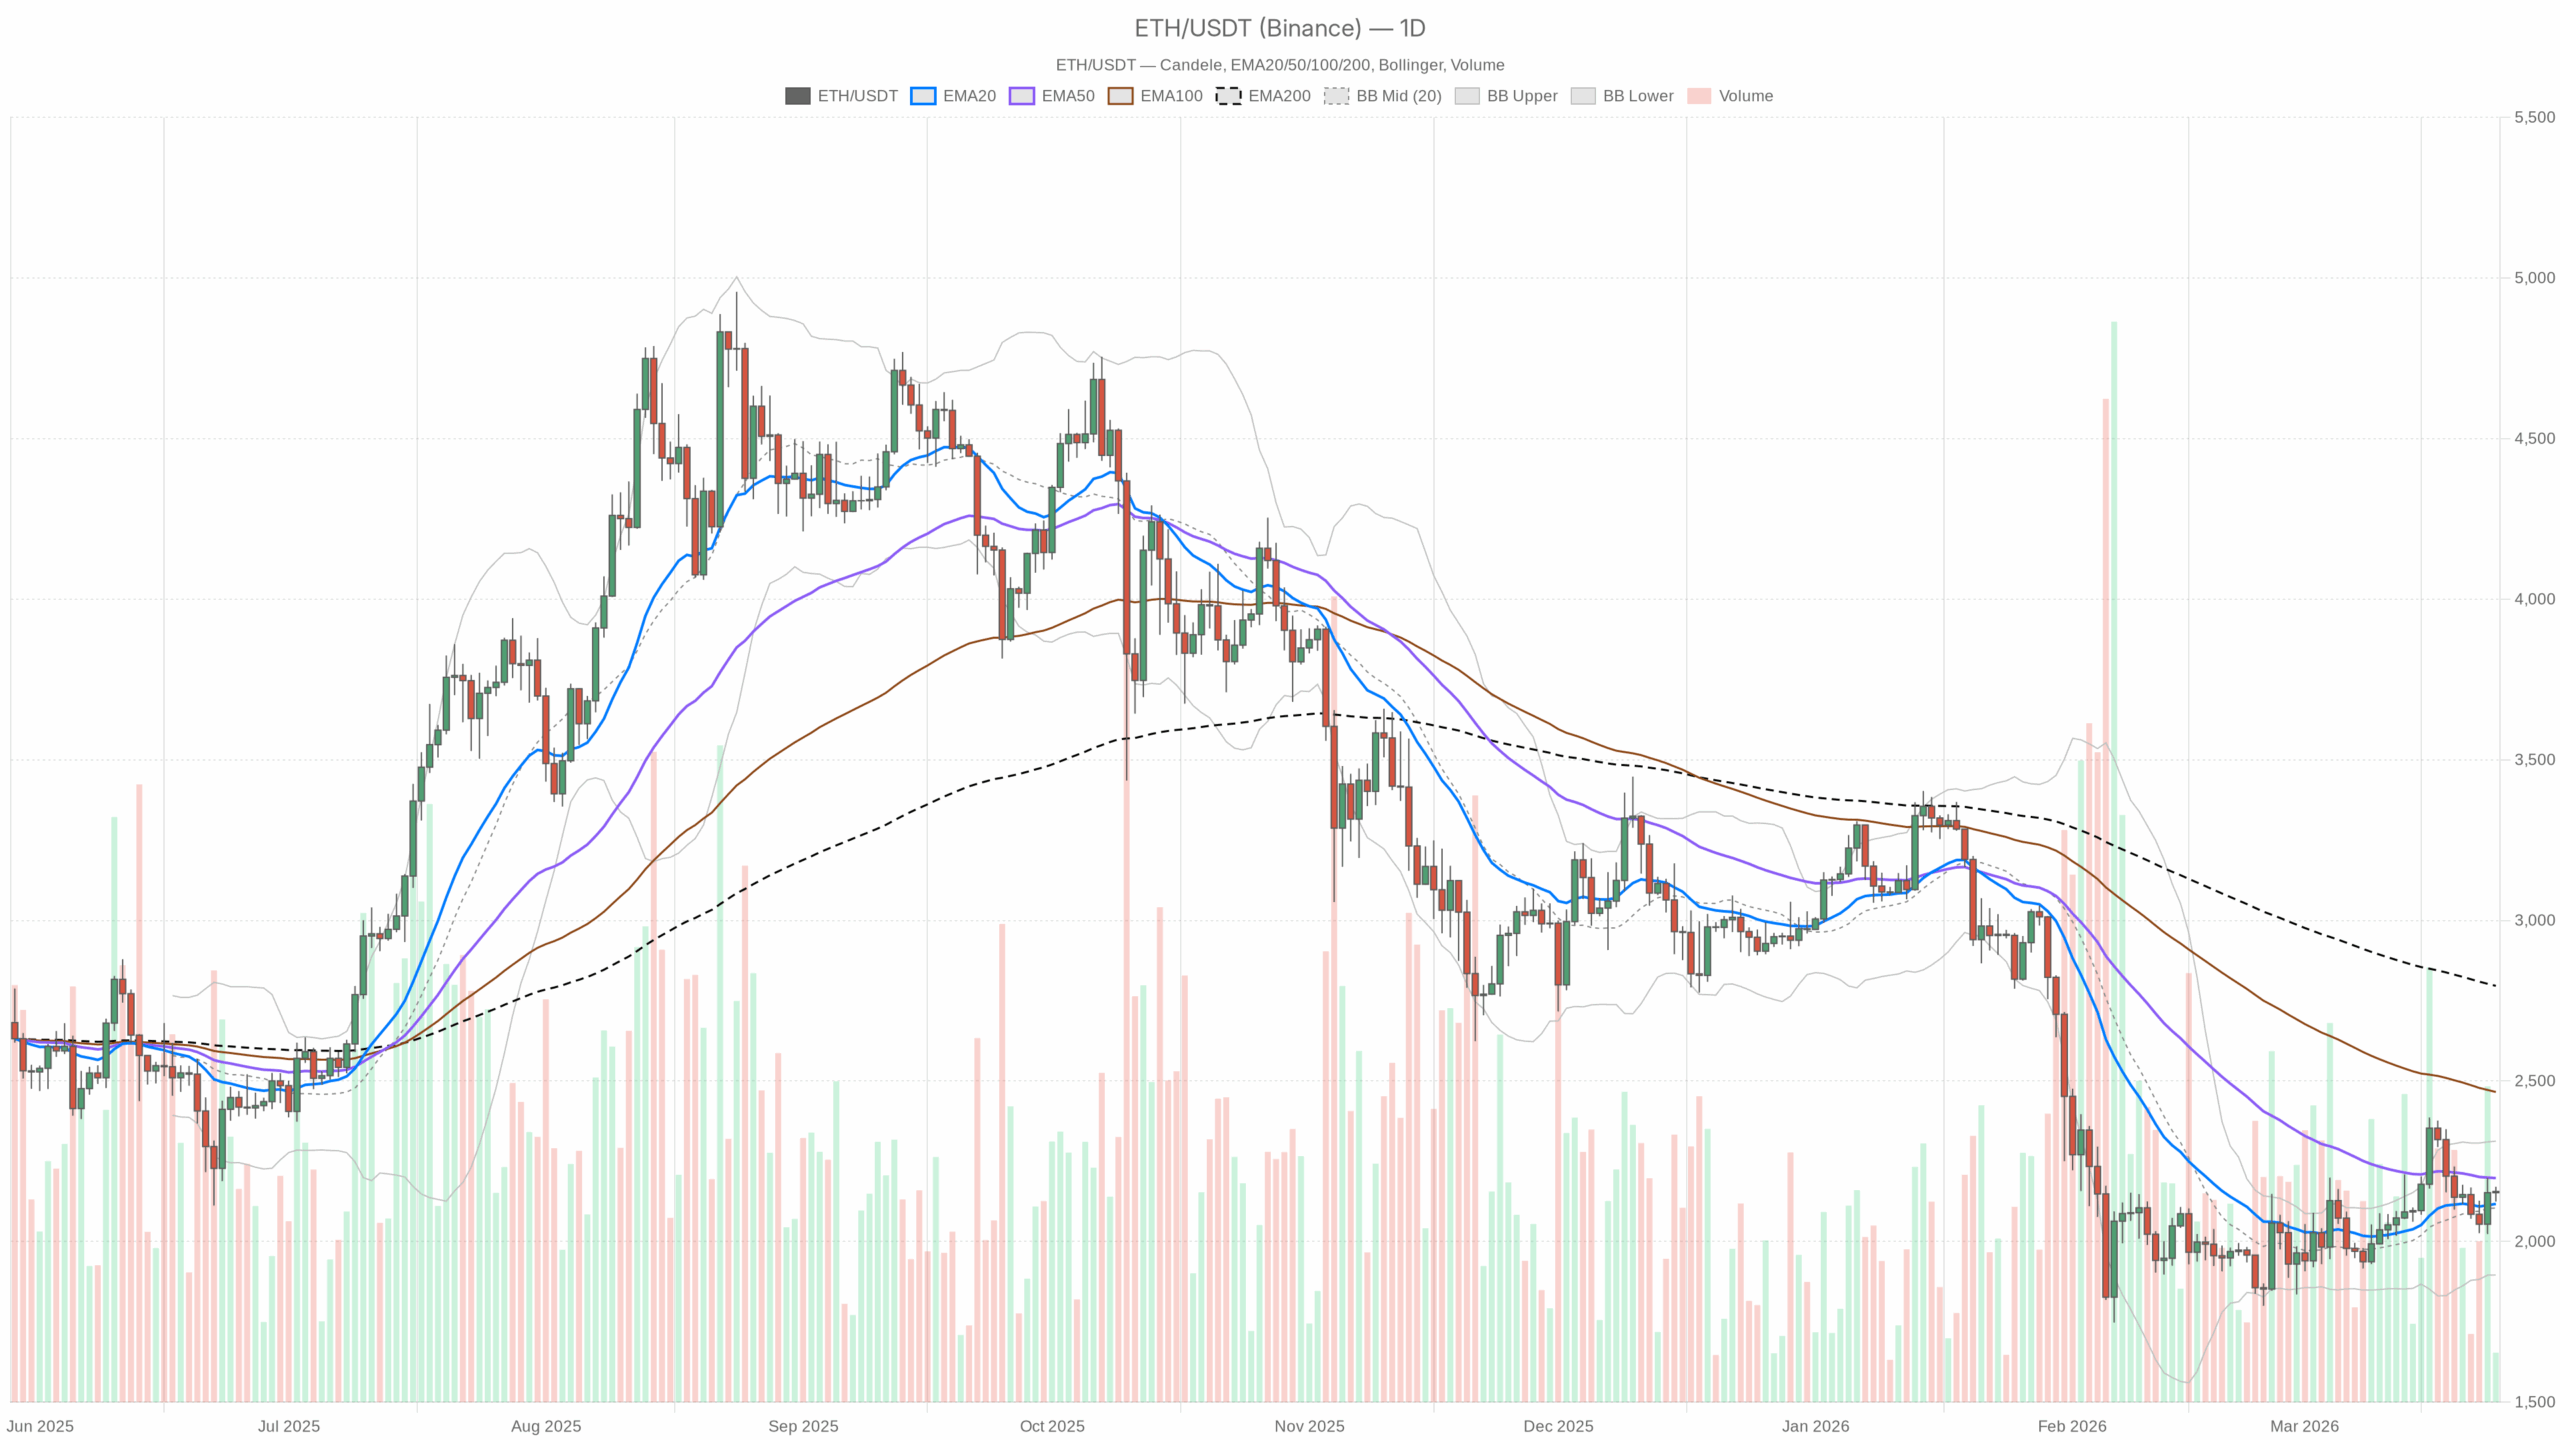 ETH/USDT daily chart with EMA20, EMA50 and volume”
loading=”lazy” />ETH/USDT — daily chart with candlesticks, EMA20/EMA50 and volume.
Daily View (D1): Mildly Constructive Inside a Damaged Macro Trend
The daily timeframe defines the main scenario, and right now the bias is cautiously bullish in the short to medium term but still structurally bearish when you zoom out.
Trend Structure – EMAs
- Price: $2,155.82
- EMA 20: $2,117.07
- EMA 50: $2,197.46
- EMA 200: $2,796.07
ETH is trading above the 20-day EMA but below the 50-day and far below the 200-day. That is the textbook look of an asset attempting a rebound inside a broader downtrend. Short-term momentum has flipped positive, but the intermediate trend at the 50-day still caps price and the long-term trend near $2,800 is firmly bearish. Until ETH can reclaim and hold above the 50-day, rallies are guilty until proven otherwise.
Momentum & Strength – RSI and MACD
- RSI (14): 52.66
Daily RSI sitting just above 50 shows moderate bullish pressure without any sign of overextension. Buyers have the upper hand, but only slightly. This is the kind of reading you see when a market is trying to stabilize after a selloff rather than exploding into a strong trend.
- MACD line: 16.67
- Signal line: 13.17
- Histogram: 3.50
With the MACD line above the signal and a positive histogram, daily momentum is tilted to the upside. The move is constructive but not aggressive, and it supports the idea of a gradual grind higher rather than a vertical breakout. Combined with RSI near neutral, momentum favors slow accumulation rather than euphoric chasing.
Volatility & Range – Bollinger Bands and ATR
- Bollinger Bands (20): mid $2,104.21, lower $1,895.87, upper $2,312.55
Price is trading near the middle to upper half of the Bollinger Bands, hovering slightly above the midline. This is consistent with a market that has pulled off the lows but has not yet entered a strong breakout phase. There is room for ETH to push toward the upper band near $2,310 without immediately looking stretched.
- ATR (14): $112.45
A daily ATR a bit above $110 signals healthy but not extreme volatility. Swings of roughly $100–$120 in a day are currently normal. Position sizing needs to respect that, because the market can easily chew through intraday levels without breaking the broader structure.
Key Daily Levels – Pivots
- Pivot point (PP): $2,150.24
- Resistance R1: $2,176.23
- Support S1: $2,129.84
ETH is trading almost exactly at the daily pivot. That tells you the market has not picked a firm intraday direction yet, and it is a balance point between buyers and sellers. Holding above $2,150 leans the day slightly bullish, with $2,176 as the first upside checkpoint. A sustained move below $2,130 would flip the tone back defensive and invite a deeper test of the 20-day EMA around $2,117.
Daily takeaway: Short-term recovery is in play, but it is still happening under the shadow of a much heavier long-term downtrend. Bulls are probing higher, not in control yet.
Hourly View (H1): Recovery Stalling Into Intraday Resistance
The hourly chart refines the picture. Here the message is more mixed: structure still supports upside, but momentum has cooled and short-term traders are hesitating.
Trend – EMAs on H1
- Price: $2,154.90
- EMA 20: $2,138.83
- EMA 50: $2,123.67
- EMA 200: $2,141.83
On the hourly chart, ETH is trading above all three EMAs. The 20, 50 and 200-hour averages are stacked in bullish order, which supports the idea of a short-term uptrend. Compared with the daily, the H1 looks meaningfully stronger, and this is where you see the active buying that is trying to repair the higher timeframe damage.
Momentum – RSI and MACD on H1
- RSI (14): 57.63
Hourly RSI in the high 50s shows decent bullish momentum but not mania. Dips are being bought, but intraday buyers are not overheating.
- MACD line: 12.35
- Signal line: 13.82
- Histogram: -1.47
Here is the first real conflict: the MACD histogram on H1 is negative, with the MACD line slipping below the signal. That points to fading momentum within the short-term uptrend. Price is still above its key EMAs, but the engine underneath the move is cooling. This often happens when a market runs into nearby resistance and traders start taking quick profits.
Volatility & Range – Bollinger Bands and ATR on H1
- Bollinger Bands (20): mid $2,151.25, lower $2,120.69, upper $2,181.82
- ATR (14): $17.66
Price is hugging the midline of the hourly bands with relatively contained volatility, around an $18 expected hourly range. That is typical of a consolidation phase after an impulsive move. The market is deciding whether this is just a pause before another push higher toward $2,180 and above, or the start of a roll-over.
Hourly Pivots
- Pivot point (PP): $2,158.15
- Resistance R1: $2,164.12
- Support S1: $2,148.92
ETH is trading just below the hourly pivot at $2,158. That is a subtle intraday warning sign, because buyers have not convincingly reclaimed control above the session’s balance point. Rejection around the pivot and R1 at $2,164 would confirm the loss of steam already hinted at by the MACD.
Hourly takeaway: Structure is bullish, but momentum is slipping. Short-term traders are defending the trend, while momentum indicators hint at a possible pause or shallow pullback.
15-Minute View (M15): Tactical Bullishness for Execution
The 15-minute chart is for execution timing, not big-picture decisions. Right now, it leans bullish, but this is micro-structure and it can flip quickly.
Trend – EMAs on M15
- Price: $2,154.58
- EMA 20: $2,149.21
- EMA 50: $2,144.22
- EMA 200: $2,122.97
All shorter EMAs on M15 sit below price and are stacked in strong bullish order, with the 200-period all the way down near $2,123. For intraday traders, that is a clear buy-the-dip microstructure. Pullbacks toward the 20- or 50-EMA on this timeframe are likely to attract interest as long as the higher timeframes do not break down.
Momentum – RSI and MACD on M15
- RSI (14): 55.90
RSI just under 56 shows a comfortable bullish tilt with no sign of exhaustion. Short-term buyers are active, but the move is not yet stretched.
- MACD line: 4.70
- Signal line: 2.69
- Histogram: 2.01
On M15, MACD is firmly positive, with the line above the signal and a green histogram. This lines up with the bullish EMA stack: very short-term momentum is pointing higher, favoring continuation trades rather than immediate fades.
Volatility & Pivots on M15
- Bollinger Bands (20): mid $2,145.45, lower $2,122.82, upper $2,168.07
- ATR (14): $8.84
- Pivot point (PP): $2,154.20
- Resistance R1: $2,155.31
- Support S1: $2,153.46
Price is hovering right around the 15m pivot with a tight expected noise range near $9. This is a classic scalp zone: small pushes above R1 can attract momentum scalpers, while slips below S1 can trigger quick mean reversion trades back toward the mid-BB near $2,145.
15m takeaway: Very short-term structure and momentum are bullish, offering decent tactical entries, but they are operating inside an hourly consolidation and a still-repairing daily trend.
Market Context: Risk Mood vs Ethereum Structure
Beyond the ETHUSDT chart, the broader crypto environment matters. On 24 March 2026, key market context includes:
- Bitcoin dominance: ~56.6% – BTC is firmly in the driver’s seat, which typically limits aggressive Ethereum outperformance.
- Total crypto market cap: about $2.50T, up roughly 3.2% in 24 hours – risk appetite is returning after a recent drawdown.
- 24h volume: up nearly 59% – activity is elevated, which can magnify both breakouts and failures.
- Fear & Greed Index: 11 (Extreme Fear) – sentiment is still deeply risk-off despite the bounce, a classic environment for sharp short squeezes and nasty fakeouts.
On-chain and DeFi-related proxies show Uniswap and other DEXs generating strong fees over the month, suggesting sustained Ethereum ecosystem activity. That underpins a longer-term constructive thesis, but price is currently trading more in sync with macro risk flows than DeFi fundamentals.
Main Scenario: Cautiously Bullish, Still Inside a Larger Downtrend
Based on the daily chart, the main scenario for Ethereum today is short-term bullish within a structurally bearish backdrop. This aligns with the mixed picture seen across timeframes.
Daily EMAs and MACD point to a developing recovery, while RSI and Bollinger Bands back the view of a market coming off the lows but not yet overheated. However, the yawning gap to the 200-day EMA around $2,800 and price still below the 50-day near $2,200 show the longer-term bear structure is intact.
The timeframes are not fully aligned. M15 and H1 EMAs are bullish, but H1 MACD is rolling over. That creates a tug-of-war between very short-term breakout attempts and a potential intraday stall.
Bulllish Scenario for ETHUSDT
In the bullish path, today’s consolidation above the daily pivot turns into a proper continuation move.
- What needs to happen:
ETH holds above the daily pivot at $2,150 and the nearby support at $2,130. The hourly MACD flattens and turns back up, aligning with the already bullish EMAs on H1 and M15. Price then pushes through the immediate intraday resistances: first H1 R1 near $2,164, then the daily R1 around $2,176. - Next targets:
A sustained break above $2,176 opens the way toward the upper daily Bollinger Band near $2,310, with the 50-day EMA around $2,197–2,200 as the first meaningful structural test. If ETH can reclaim and hold above the 50-day, the conversation shifts from a bounce to a potential trend reversal. - Momentum confirmation:
RSI on the daily drifts toward the 60–65 region without spiking into extremes, and MACD widens its positive histogram. On H1, MACD would need to reclaim positive territory while price rides above the 20-EMA on pullbacks.
What invalidates the bullish scenario:
A clear close below the 20-day EMA at about $2,117 would undermine the bounce structure. If that break is accompanied by daily RSI dropping back below 50 and MACD flattening or crossing down, the short-term bullish case weakens dramatically and the market reverts to sell-the-rip behavior.
Bearish Scenario for ETHUSDT
On the bearish side, the current move up is just a relief rally within a primary downtrend.
- What needs to happen:
ETH fails to hold above the daily pivot and starts to trade consistently below $2,130, dragging price down toward the 20-day EMA at $2,117. H1 MACD remains negative or deteriorates further while price slices back through the hourly 20- and 50-EMAs. - Downside areas:
A loss of the 20-day EMA exposes the mid-Bollinger zone around $2,100 and then opens the door to a deeper retest toward the lower half of the Bollinger Bands. Price could potentially gravitate toward the lower band near $1,896 if selling accelerates. In an environment of extreme fear, downside moves can be sharp once key supports snap. - Momentum confirmation:
Daily RSI rolls back under 50, signaling loss of control by buyers, while MACD’s histogram shrinks toward zero or turns negative. On lower timeframes, M15 flips from bullish to neutral or bearish as price loses the 200-EMA and volatility, measured by ATR, picks up to the downside.
What invalidates the bearish scenario:
If ETH breaks and holds above the 50-day EMA around $2,200, with daily closes sustaining above that level and H1 continuing to respect the 20- and 50-EMA as support, the bearish just-a-bounce narrative is in trouble. Bears need price to stay capped below the 50-day for their scenario to remain credible.
Positioning, Risk, and Uncertainty
Ethereum today sits in a fragile balance: the shorter timeframes lean bullish, the daily shows a healing but not yet reversed trend, and the long-term 200-day EMA is still firmly negative. At the same time, market-wide sentiment is in extreme fear even as prices and volumes rise.
For directional traders, this is the kind of environment where timeframe discipline matters more than usual. Short-term longs are working as long as ETH holds above the 20-day EMA and intraday EMAs on H1, but the room above is limited by the 50-day and upper Bollinger Band. Moreover, aggressive shorts can find opportunity near those higher resistance zones, but they are trading against improving daily momentum and a market that can still squeeze higher on any positive news or risk-on wave.
Volatility is elevated but not extreme. ATR readings tell you that daily swings of just over $100 are normal, so stops and position sizing need to be calibrated accordingly. Tight levels that ignore this reality are likely to be noise-stopped.
In summary, Ethereum’s chart is cautiously constructive in the short term, but it is not out of the woods. Whether this bounce becomes the foundation of a larger uptrend or just another rally to sell into will be decided around the $2,100–$2,200 band. That is the battleground where trend, momentum, and sentiment will either align for a deeper recovery or roll over into the next leg down.


You May Also Like

US Dollar Index Trims Early Gains as Traders Await February CPI Report

What Are AI Agents and Why Are They Becoming So Popular?