Cardano price analysis: ADA balances between exhausted sellers and short-term FOMO
In this market phase, the Cardano price is caught between a fading higher timeframe downtrend and short-term speculative buying pressure around key technical levels.
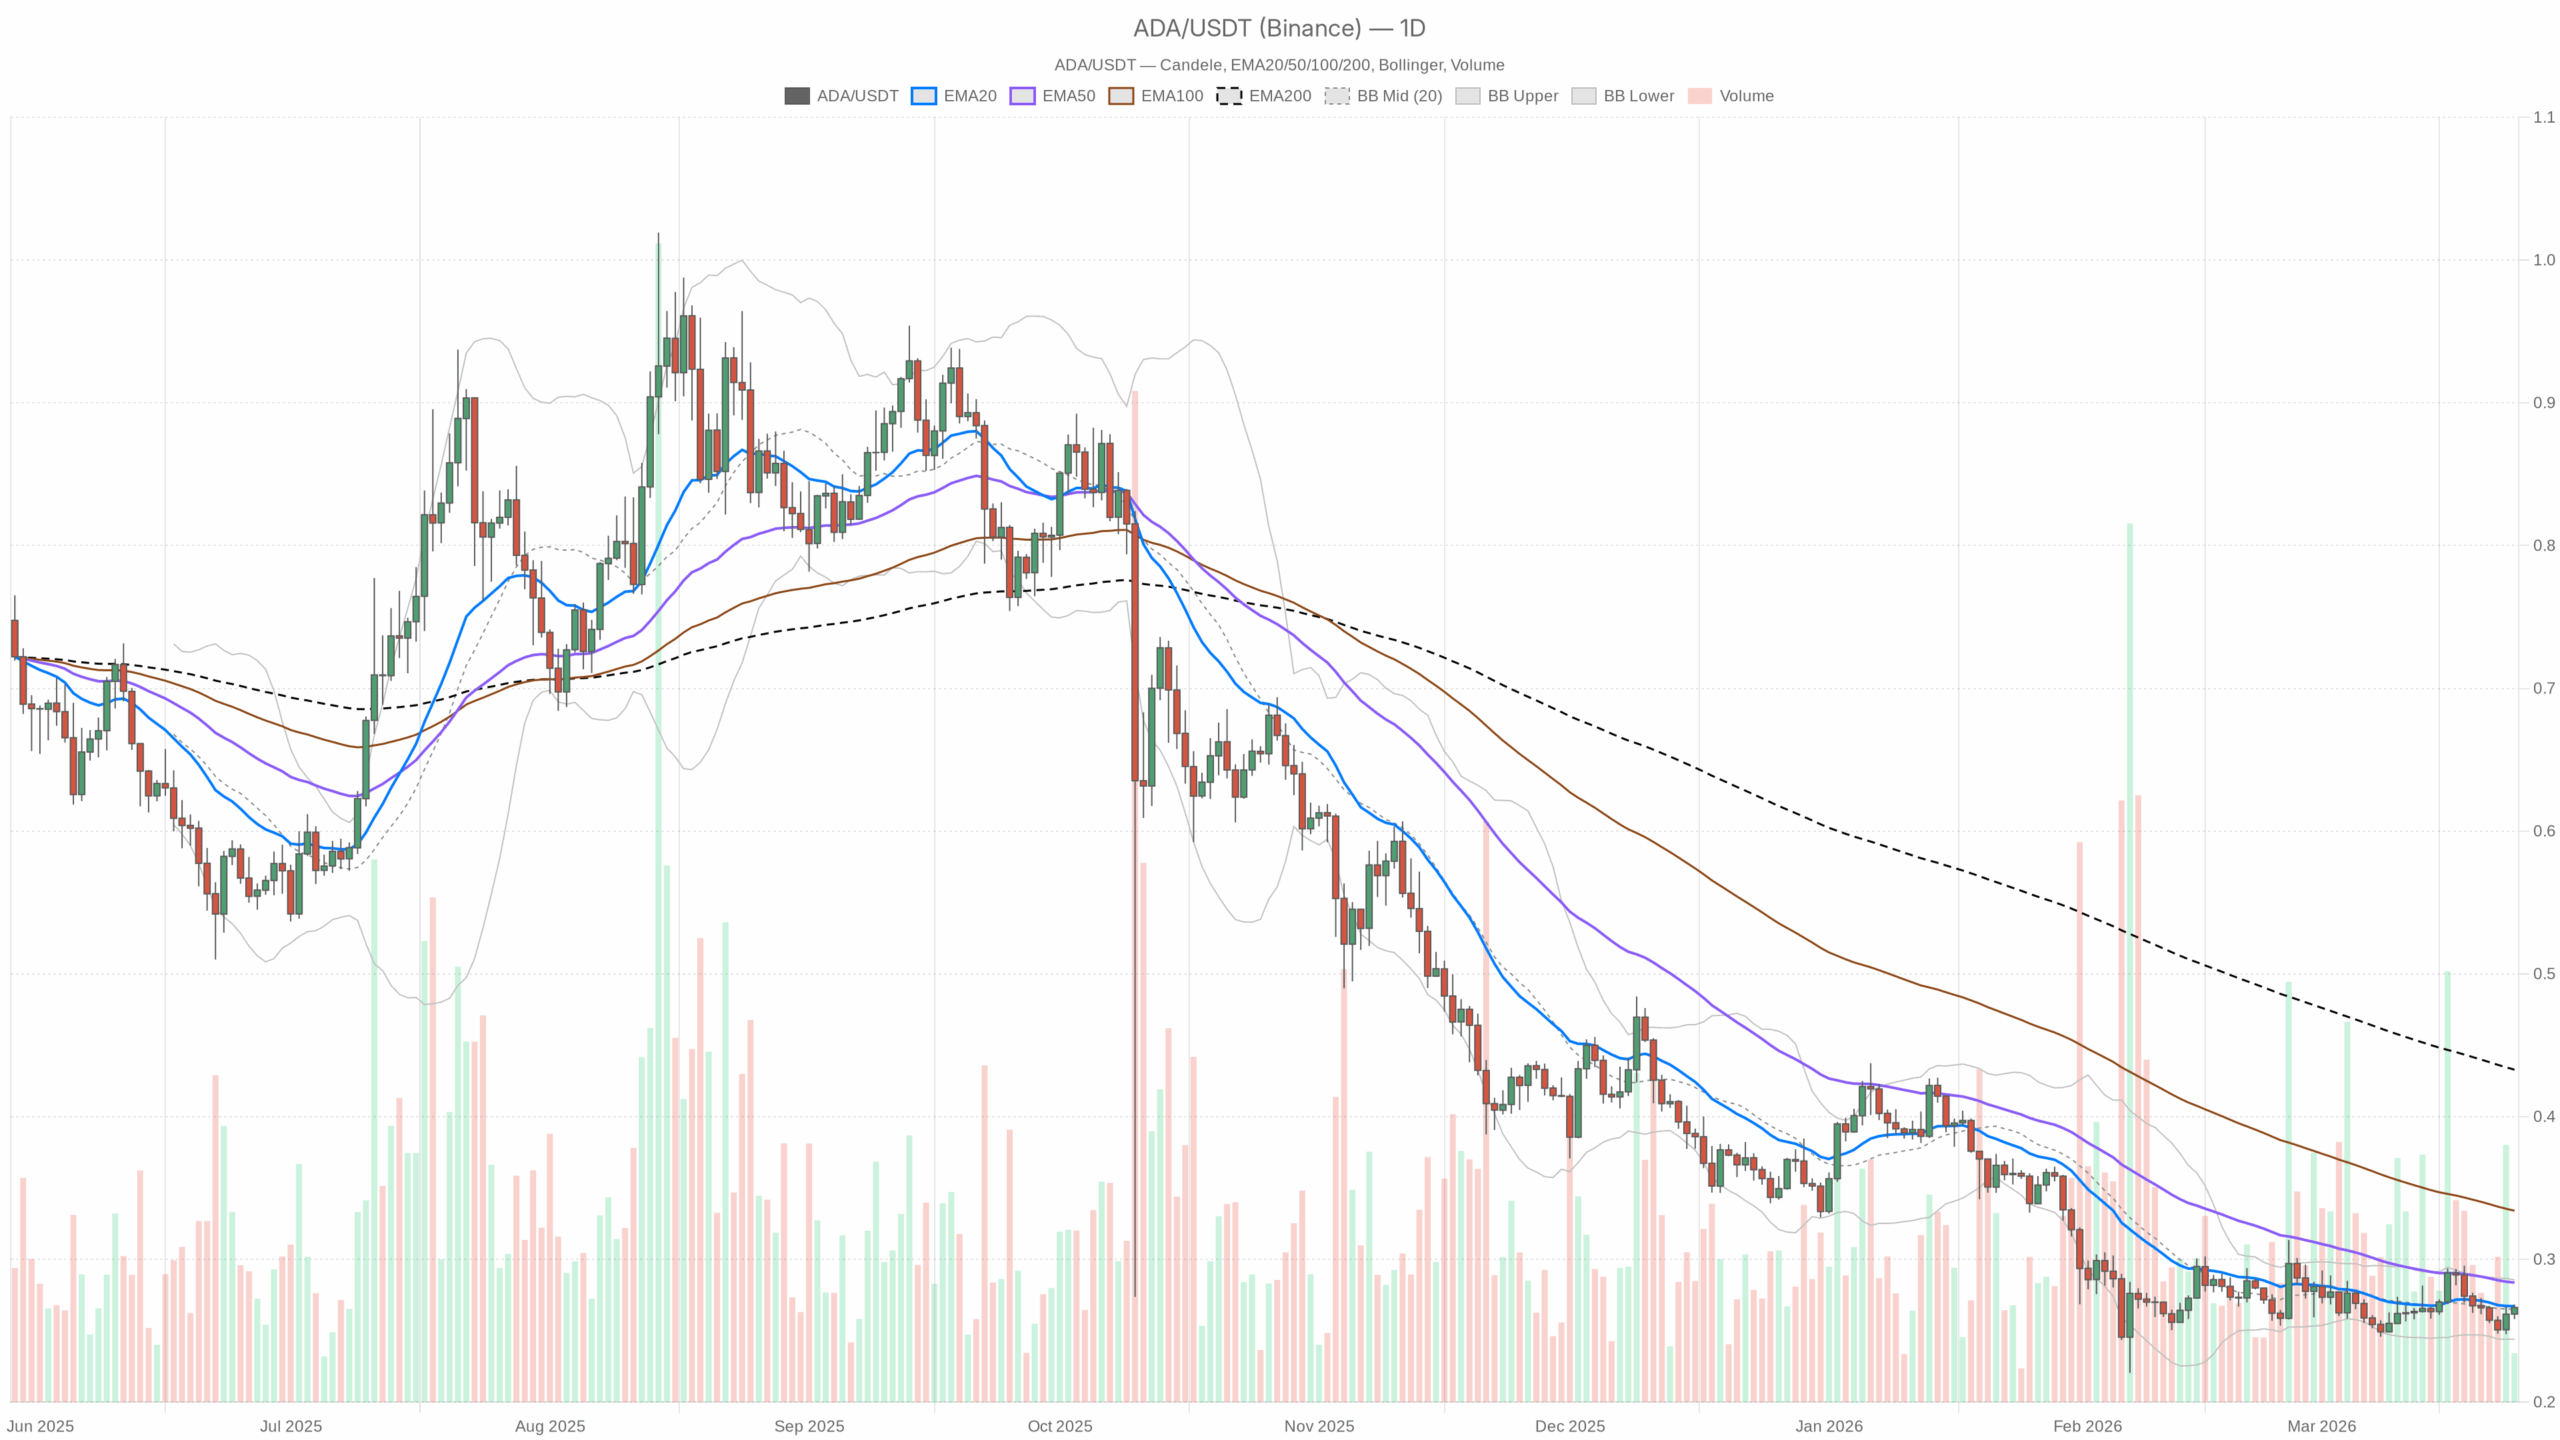 ADA/USDT — daily chart with candlesticks, EMA20/EMA50 and volume.
Cardano price: where ADAUSDT stands now
Cardano is trading around $0.27 against USDT, sitting right on top of its daily 20-day EMA and just below the 50-day EMA, in a broader downtrend defined by a much higher 200-day EMA at $0.43. The higher timeframe message is clear: this is still a bearish market that is trying to stabilize rather than a confirmed trend reversal.
What makes this moment interesting is the clash between timeframes. The daily chart shows a tired downtrend with signs of mean reversion, while the intraday picture (1H and 15m) has shifted into short-term momentum buying. However, longer-term structure is still bearish, while short-term traders are leaning bullish and pressing into resistance.
Given the daily bearish regime and the distance from the 200-day EMA, the main scenario is still bearish, but with increasing risk of a corrective bounce or extended range rather than a fresh collapse.
Daily timeframe (D1): structure still bearish, pressure easing
Trend and EMAs (20 / 50 / 200)
price $0.27, EMA20 ≈ $0.27, EMA50 ≈ $0.28, EMA200 ≈ $0.43, regime: bearish.
Price has climbed back to the 20-day EMA and is still trading below the 50-day and far below the 200-day. That setup is textbook bearish structure: rallies are still, by default, counter-trend. The fact that price is hugging the 20-day EMA shows sellers are losing immediate control, but they have not actually been displaced; ADA is merely testing the lower boundary of its old value area, not breaking out into a fresh uptrend.
RSI (14)
RSI14 ≈ 48.3 on the daily chart.
Daily momentum is neutral, slightly below the midline. That usually aligns with a market in balance after a down leg: selling pressure has cooled, but buyers have not taken over. In practical terms, ADA is in a wait-and-see zone where the next push, either above the 50-day EMA or back under the Bollinger mid, will likely define the next short swing.
MACD
MACD line ≈ 0, signal ≈ 0, histogram ≈ 0.
MACD is essentially flat, which fits the idea of a fading trend. There is no clear bullish or bearish momentum signal on the daily: the prior downtrend has run out of steam, but a new uptrend has not started. This flattening is often what you see before either a volatility contraction and range, or a base-building phase that can later break.
Bollinger Bands
mid ≈ $0.26, upper ≈ $0.29, lower ≈ $0.24.
ADA is trading just above the middle band and well inside the envelope. That tells us two things: first, price has moved off the lower band, so the heaviest selling has relented; second, it is not yet pressing the upper band, so buyers are not in full control. The daily bands frame a working range roughly between $0.24 and $0.29. Until one of those edges is taken out, the dominant play is mean reversion within that corridor rather than trend extension.
ATR (14)
ATR14 ≈ $0.01 on the daily chart.
Daily volatility is modest: a typical daily swing is around one cent. That is relatively contained for ADA at this price level and signals compression after recent moves. When ATR contracts in a bearish regime, it often precedes a larger directional move; the issue is that direction is not yet obvious from volatility alone.
Daily Pivot Levels
Pivot point (PP) ≈ $0.26, R1 ≈ $0.27, S1 ≈ $0.26.
Price is currently trading right at R1 and slightly above the pivot. That means the market has already pushed through the day’s average value area on the upside, but it is now running into its first overhead intraday resistance band. In plain language, the easy part of today’s bounce may be behind us, and further upside from here likely requires fresh buying, not just short-covering.
1-hour timeframe (H1): short-term momentum pushing into resistance
Trend and EMAs (20 / 50 / 200)
price $0.27, EMA20 ≈ $0.26, EMA50 ≈ $0.26, EMA200 ≈ $0.26, regime: neutral.
On the hourly chart, ADA is trading above all three main EMAs, which are clustered close together around $0.26. That clustering followed by price lifting above it is typical of a short-term momentum burst out of a consolidation. The neutral regime tag is fair: structurally the trend is not well established, but over the last several hours buyers have had the upper hand.
RSI (14)
RSI14 ≈ 68.0 on H1.
Hourly RSI is flirting with overbought. That does not mean price must reverse here, but it does tell you the immediate move has been fast relative to recent history. From a risk-reward standpoint, chasing fresh longs on this timeframe is starting to become late unless you expect continuation into the top of the daily Bollinger range around $0.29.
MACD
MACD line ≈ 0, signal ≈ 0, histogram ≈ 0.
Despite the stronger RSI, MACD on H1 is effectively flat, mirroring the daily. Momentum has picked up just enough to move oscillators, but not enough to carve out a clean bullish MACD leg. It is a subtle sign that the move may be more about short-term positioning and liquidity pockets than a deep shift in trend.
Bollinger Bands
mid ≈ $0.26, upper ≈ $0.27, lower ≈ $0.26.
Price is near the upper hourly band around $0.27, with the bands relatively tight. That is what an intraday push into resistance looks like: buyers have worked price up to the top of a narrow volatility channel. Either we see a brief squeeze above followed by a fade back into the band, or we get a clean expansion with bands widening and price riding the upper side. At the moment, the setup leans more like a short-term extension rather than a powerful breakout.
ATR (14) & Pivot
ATR14 ≈ $0.00 (very low), pivot ≈ $0.27 with R1/S1 ≈ $0.27.
Measured hourly volatility is extremely compressed, and price is clustering around the pivot and intraday resistance band. That combination usually means one of two things: either the market is about to get a fast expansion move as liquidity returns, or price continues to grind in a tight range, frustrating both sides. For now, traders are leaning lightly bullish inside a low-energy environment.
15-minute timeframe (M15): stretched short-term longs
Trend and EMAs
price $0.27, EMA20 ≈ $0.26, EMA50 ≈ $0.26, EMA200 ≈ $0.26, regime: bullish.
On the 15-minute chart, price is clearly above the EMA cluster, and the regime is marked bullish. That is what you expect after an intraday push higher. From an execution standpoint, these are the conditions where late longs often get trapped if the move stalls at higher timeframe resistance, so the location relative to daily levels matters more than the local trend label.
RSI (14)
RSI14 ≈ 69.3 on M15.
Short-term RSI is brushing against overbought. This aligns with the 1H picture: the immediate bounce has been sharp enough that adding new exposure on this micro timeframe carries poor asymmetry unless you are specifically trading for a quick continuation scalp.
MACD & Bollinger Bands
MACD ≈ flat at 0; Bollinger mid ≈ $0.26, upper ≈ $0.27, lower ≈ $0.26.
Once again, MACD is not confirming a strong impulse, and price sits near the upper band in a tight volatility envelope. This is consistent with intraday FOMO grinding into resistance more than a genuine breakout phase.
Broader market and sentiment backdrop
The wider crypto market cap is up about 3.2% over 24h, with BTC dominance around 56.6%. Flows are still heavily skewed toward Bitcoin, which usually limits how far altcoins like ADA can run on their own. At the same time, the crypto Fear & Greed Index is deep in Extreme Fear (11). That mix, risk capital flowing in but sentiment still fearful, often creates good conditions for sharp mean-reversion bounces, but it is not yet the environment of a sustained, risk-on altseason.
On-chain DeFi metrics for Cardano show DEX fee activity up sharply over the last day across several platforms (Minswap, WingRiders, SundaeSwap, Danogo). Moreover, that uptick in protocol usage points to improving network activity, which can underpin medium-term value, but these are still early signals rather than a decisive macro driver.
Main bias: structurally bearish, tactically balanced
Putting it all together:
- The daily regime is bearish, with price under the 50-day and far below the 200-day EMA.
- Momentum indicators (RSI, MACD) on D1 are neutral and flattening, consistent with a market pausing after a downtrend rather than reversing strongly.
- Intraday charts (H1, M15) are short-term bullish, but with RSI stretched and volatility compressed near resistance.
Overall, the primary scenario remains bearish on the higher timeframe, but the market is in the corrective or sideways phase of that downtrend. The balance of evidence favors range trading and mean reversion between roughly $0.24 and $0.29 rather than an immediate trend breakdown or explosive rally.
Scenarios for Cardano price (ADAUSDT)
Bulish scenario: corrective rally toward upper band
In the bullish case, the current intraday strength develops into a broader short-covering rally.
Key elements of this path:
- Daily close holds above the 20-day EMA (~$0.27) and defends the pivot region around $0.26 on pullbacks.
- Hourly RSI cools from 68 toward the mid-50s without a deep price retrace, showing consolidation rather than rejection at current levels.
- Bollinger Bands on D1 start to slightly expand to the upside, with price pushing toward the upper band around $0.29.
If these conditions line up, ADA can reasonably test the $0.29 area, where the upper daily band sits. A stronger extension could see price probing toward the 50-day EMA near $0.28–0.30 and turning that zone into a battle line between bulls and bears.
What invalidates the bullish scenario?
- A clear daily close back below $0.26 (the daily pivot and mid-BB) would show that the bounce failed and sellers are regaining control.
- On intraday charts, a drop back below the EMA cluster around $0.26 on rising ATR would tell you the short-term structure has rolled over.
If those signals appear, the idea of a controlled corrective rally toward the upper band loses credibility.
Bearish scenario: resumption of the downtrend within the range
In the bearish case, today’s strength proves to be nothing more than a rally into resistance within a still-dominant downtrend.
Key elements of this path:
- Price fails to sustain above $0.27 and is pushed back under the daily pivot and mid-BB around $0.26.
- Hourly and 15m RSI roll over from near-overbought to sub-50 along with price, not just through time-based consolidation.
- Daily ATR begins to tick higher from ~$0.01 as red candles re-emerge, signaling that volatility is returning in favor of the sellers.
Under this scenario, ADA drifts back toward the lower daily Bollinger Band near $0.24. If selling pressure accelerates, that band can be breached, opening room for a deeper leg down. In a higher-volatility flush, moves below $0.24 would not be surprising given the still-bearish 200-day structure.
What invalidates the bearish scenario?
- A sequence of daily closes above $0.28–0.29, especially if accompanied by EMAs starting to flatten and curl up.
- A shift of the daily regime from bearish toward neutral with price holding above the 20- and 50-day EMAs instead of rejecting them.
Such a change would indicate that the downtrend is transitioning into a broader base, and that the dominant force is no longer sellers on the higher timeframe.
Positioning, risk, and what matters next
Right now, ADA sits at an awkward intersection:
- Longer-term traders still see a downtrend anchored by the 200-day EMA up at $0.43.
- Short-term traders are playing a bounce off the lower half of the Bollinger range, with intraday momentum pushing into resistance.
- Sentiment is extremely fearful across crypto, but Cardano’s on-chain activity is improving at the margin.
For positioning, the key is timeframe discipline:
- If you operate on the daily or weekly horizon, ADA is still in a bear phase. Any long exposure here is effectively a counter-trend or range trade, which typically demands tighter risk controls and more modest expectations.
- If you are trading intraday, the market is already leaning long in the very short term. That means fresh buys at current levels are vulnerable to pullbacks if the daily resistance zone around $0.27–0.29 holds.
Volatility is compressed on intraday charts, and daily ATR is low. That combination rarely lasts. The next decisive move is likely to come from a break out of the current range, either toward the upper daily band near $0.29 or back toward the lower band around $0.24. For now, the burden of proof is still on the bulls: the structure is bearish, even if the tape feels better than it did at the recent lows.
In summary, this Cardano price setup reflects a counter-trend phase inside a broader downtrend, with clear range boundaries and mixed signals between higher and lower timeframes.


You May Also Like
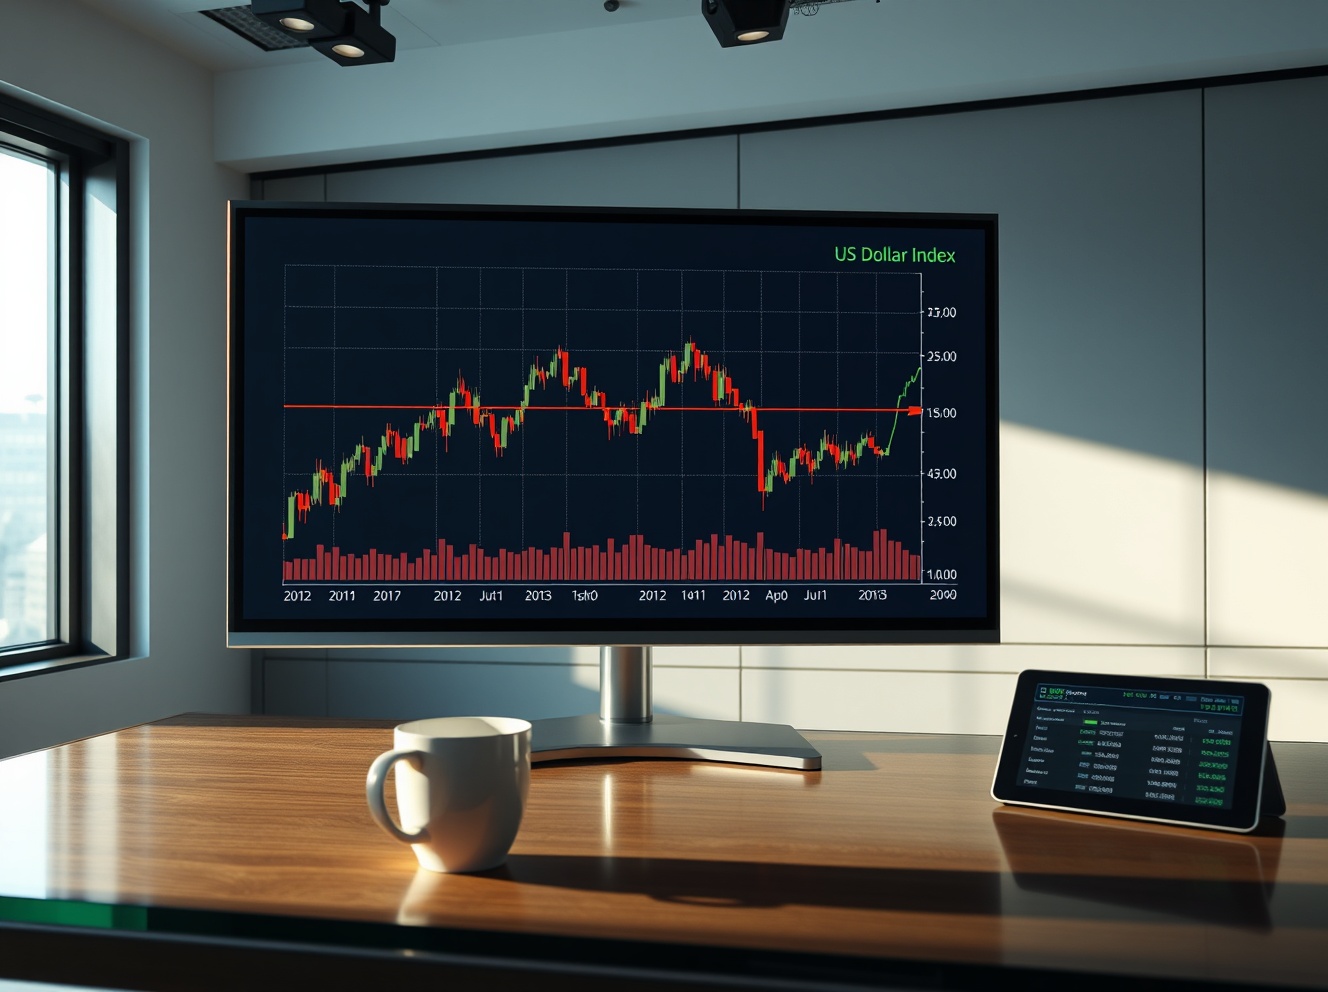
US Dollar Index Trims Early Gains as Traders Await February CPI Report

What Are AI Agents and Why Are They Becoming So Popular?