Silver Price Prediction: Nearly 50% Pullback From the Peak, So What’s Next?
Silver price has entered a critical phase after a sharp correction from its late January peak. As of now, silver trades around $68 after reaching an intraday high of $121.69 earlier in the year. That move represents a roughly 45% drop, which signals that the market has shifted from a strong expansion phase into a retest phase.
This is not just a normal pullback. The market is now testing whether key levels can hold or whether the correction will extend further. If support fails and fundamentals weaken, downside pressure could accelerate quickly.
Silver price currently sits close to the $63 to $67 support region. This is the same area where price first stabilised after the initial drop from the January high. That detail matters because it shows this level already acted as a reaction point once before.
Despite the decline, silver still holds more than 100% gains compared to March 26, 2025. That year-on-year strength confirms that the broader trend has not completely broken, even though the short-term structure has weakened.
Volatility also gives important context. January alone saw a roughly 40% price range, which shows how quickly the market moved from a parabolic rise into a corrective phase. That type of movement usually leaves unstable structure behind, which explains why the current retest phase looks fragile.
Key Factors Behind Silver Price Pullback Explain Why The Correction Was So Sharp
Several developments came together to push silver lower.
Federal Reserve expectations changed after the nomination of Kevin Warsh. That reduced expectations for aggressive rate cuts and strengthened the US dollar. A stronger dollar usually creates pressure for silver price.
Margin requirements also played a major role. The CME Group increased margin levels for silver futures in late January. That forced leveraged traders to close positions, which added to the speed of the decline.
Industrial demand reacted to high prices as well. Manufacturers began reducing silver usage or switching to alternatives such as copper. This process slowed demand at a time when price was already under pressure.
Geopolitical factors created a mixed effect. Middle East tensions initially supported silver through safe-haven demand. At the same time, higher oil prices strengthened the US dollar, which then pushed silver lower. That contradiction added complexity to the move.
Silver Price Support Zone Between $63 And $67 Will Decide Next Direction
The $63 to $67 region has already proven its importance multiple times. The first test came after the initial drop from the January high, where silver held around $64 and bounced. The same area showed reactions again around March 19 and March 21.
This repeated behavior shows that buyers have consistently stepped in at this level.
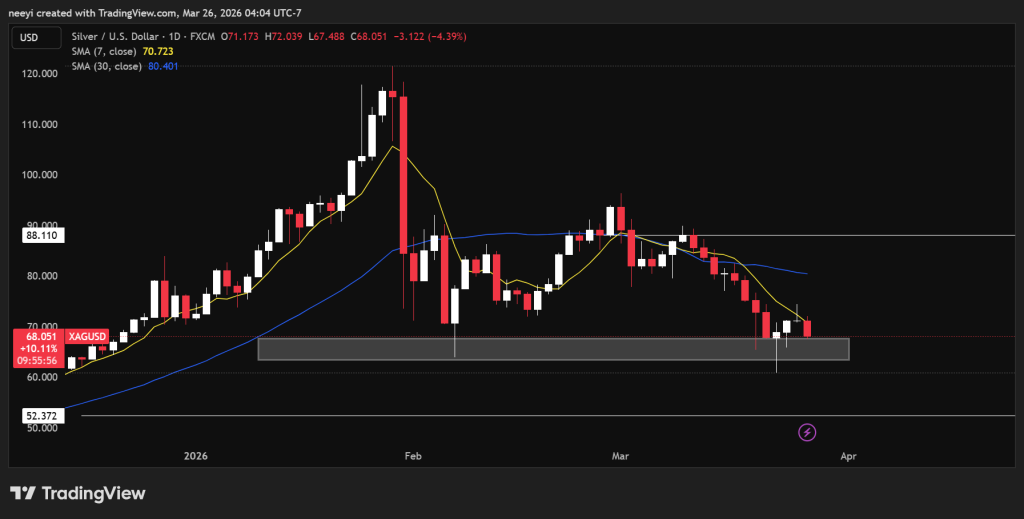 Silver Price Chart / Source: TradingView.com
If silver continues to hold above this support, then the most likely outcome is consolidation. That would mean price remains within a range for some time as the market stabilises.
If bullish strength does not return, this consolidation could last longer than expected. A loss of this support changes the outlook completely. A breakdown would likely trigger liquidations across positions that rely on this level. That scenario could push silver price into the $50 range in the coming days.
Silver Price Resistance Levels Show What Needs To Break For Upside Recovery
The first barrier on the upside sits around $73 to $74. This level acts as immediate resistance based on recent price behavior.
If silver breaks above this zone, the next move could extend into the $80s fairly quickly. That would signal that buyers have regained some control after the correction.
Beyond that, a stronger recovery could push price toward the $78 to $100 range over time. That move depends on sustained demand and improving market conditions. Without that confirmation, upside moves remain limited to short term rebounds.
Silver Price Also Depends On Broader Supply Demand And Macro Factors
Silver price does not move based on technical levels alone, and several underlying factors can influence direction in the coming weeks.
The market continues to face a structural supply deficit, with demand exceeding supply by roughly 160 to 200 million ounces. Supply remains constrained because most silver production comes from other mining activities, which limits how quickly output can increase.
Read Also: Can Binance Coin (BNB) Deliver an 8x Move to $5,000 Next Altseason?
Inventories remain low across major storage hubs, which raises the risk of tighter supply during periods of strong demand. Industrial demand continues to grow, especially from solar energy, AI infrastructure, and electric vehicles, all of which require significant amounts of silver.
Geopolitical developments and trade policies can also affect supply flows, especially with new export controls from China. At the same time, expectations around interest rates and currency strength will influence investor demand for silver as a non-yielding asset.
Subscribe to our YouTube channel for daily crypto updates, market insights, and expert analysis.
The post Silver Price Prediction: Nearly 50% Pullback From the Peak, So What’s Next? appeared first on CaptainAltcoin.


You May Also Like
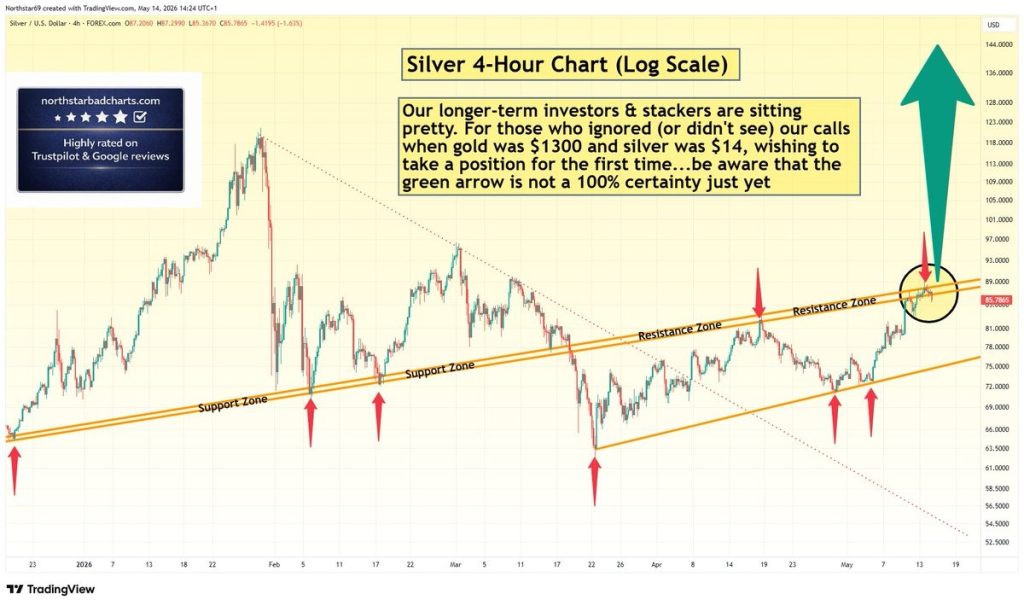
Silver Price Warning: Green Arrow Setup Is Not Confirmed – Wait for Clear Signal

Facebook spotlights African cinema in 6th ‘Made by Africa, loved by the world’ campaign