Solana Rebound Hopes Rise After TD Sequential Issues a Buy Signal on SOL
- TD Sequential flashes buy signal as Solana trades near $75–$80 support zone
- SOL remains in downtrend with lower highs despite short-term stabilization signs
- Resistance at $100 holds while RSI stays neutral and MACD shows weak momentum
Solana Rebound Hopes Rise After TD Sequential Issues a Buy Signal on $SOL Today.
The latest signal has attracted interest as price trades near a key support zone. Market participants are assessing whether this setup can support a short-term recovery.
TD Sequential Signal and Market Context
A TD Sequential buy signal has appeared on the daily chart for Solana. This indicator is often used to identify potential trend exhaustion points. Traders monitor it closely when price approaches strong support areas.
The signal comes as SOL trades near the $75 to $80 range. This zone has acted as support in recent sessions. The timing of the signal aligns with a period of slowing downside momentum.
Historical use of the indicator shows that such signals can mark a reaction zone.
However, they do not always indicate an immediate reversal. As one analyst noted, “the signal suggests a rebound zone, not a confirmed trend change.”
Trend Structure Remains Under Pressure
Solana continues to show a broader downtrend on the daily timeframe. Price has formed lower highs and lower lows since the peak near $260. This pattern reflects sustained selling pressure over time.
Recent price movement toward $80 to $85 represents a limited recovery. The structure has not shifted, as resistance levels remain intact. Sellers continue to defend higher price zones.
The absence of a higher high pattern keeps the trend unchanged. Until such a shift occurs, the market structure remains weak. Price action continues to reflect a corrective phase within a downtrend.
Key Levels Define Near-Term Direction
Support levels remain critical for the current setup. The $75 to $80 range is the immediate area being tested. A break below this zone may open a move toward $60 to $65.
The $50 level stands as a broader support area on the macro chart. It has served as a base during previous cycles. Market analysts often watch such levels during extended declines.
On the upside, resistance is seen near $100. This level aligns with a prior breakdown zone and psychological barrier. Above this, the $120 to $130 range represents a stronger supply area.
Momentum Indicators Show Early Stabilization
Momentum indicators reflect mixed conditions on the daily chart.
The Relative Strength Index is between 40 and 51, which suggests neutral momentum. It remains below levels typically associated with strong buying pressure.
The MACD indicator has turned slightly positive but remains near the zero line. This positioning indicates early stabilization rather than strong momentum.
The lack of expansion suggests limited follow-through so far.
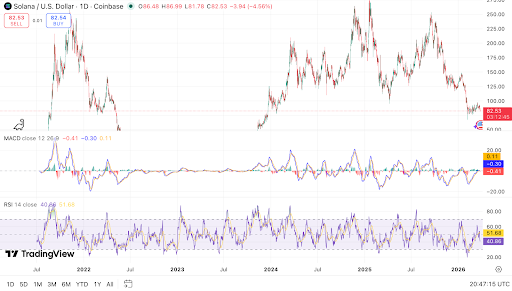 Solana tests support near $82, Source: TradingView
Solana tests support near $82, Source: TradingView
Price action shows consolidation after a sharp decline. Candles indicate reduced volatility, and this often appears before a directional move. Traders continue to monitor whether the current signal aligns with a sustained recovery.
The post Solana Rebound Hopes Rise After TD Sequential Issues a Buy Signal on SOL appeared first on Live Bitcoin News.


You May Also Like

DC insider reveals what he just heard about the plot to oust Trump

Trump DHS pulling the plug on 'Alligator Alcatraz' over financial woes: report