

Crypto Price Prediction for Today, March 30: Ethereum (ETH), XRP, Jupiter (JUP)
Crypto markets opened March 30 with a mix of consolidation and mild attempts at recovery across major altcoins. Ethereum, XRP, and Jupiter have different technical structures, but the overall picture is that the momentum is still weak, despite the attempts to recover.
Price movements over the last 24 hours show that some altcoins are trying to recover, but resistance is still an issue that hinders further price movements upwards.
Ethereum (ETH) Price Shows Weak Recovery Attempt Below Key Averages
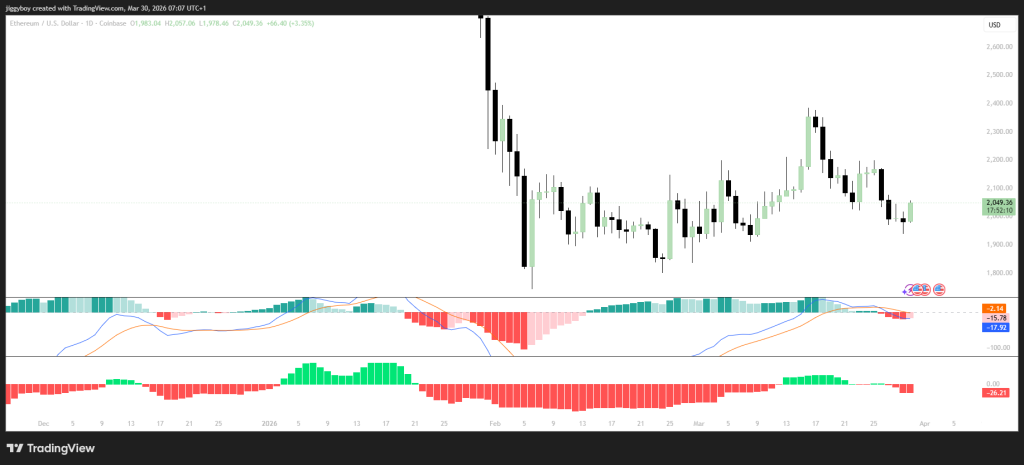
ETH is trading around $2,049 after rising somewhat in the last day or so. It has gone as low as $1,978 and as high as $2,057, so it’s definitely moving but not in crazy ways.
The rise in Ethereum’s price is happening after a challenging time in which the cryptocurrency has not been able to rise above its moving averages.
The recent struggles experienced by the Ethereum led to the price going to the lower end before the recent increase. This is not seen as a reversal of the trend since the Ethereum price is still below its 7-day and 30-day moving averages.
| Metric | Value |
|---|---|
| Price | $2,049.36 |
| RSI (14) | 47.21 |
| 7 Day SMA | $2,057.07 |
| 30 Day SMA | $2,080.26 |
| MACD Line | -2.14 |
| Signal Line | $2,057.26 |
| Histogram | -26.21 |
The momentum indicators are still in the neutral to bearish territory. The RSI is at 47.21, which indicates that the momentum is low, but ETH is still in the middle. This indicates that the market is cooled off, but it is nowhere near oversold.
Price remains mixed across moving averages. ETH is trading around $2,049 right now. In the short term, it’s trying to pick itself back up, but overall it’s still not looking very strong.
The momentum isn’t great either. It’s slightly on the negative side, which just shows the market hasn’t fully turned around yet and is still a bit weak.
Ethereum Price Prediction For Today
ETH looks kind of balanced right now, maybe leaning a bit upward after that recent bounce.
If it stays above $2,000, there’s a chance it keeps moving up, especially if it gets past around $2,050. But around $2,080 could slow things down, since that’s where sellers might step in.
 Source: TradingView.com
On the flip side, if it drops below $2,000, things could turn weak quickly, and the price might slide further down.
XRP Price Structure Shows Weak Momentum With Resistance Above
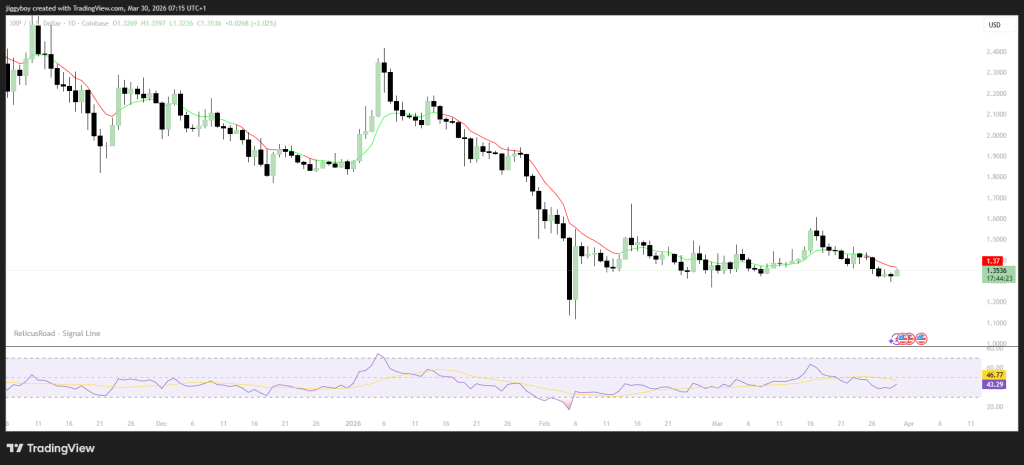
The XRP price is trading at $1.3539 with a minor dip in the last 24 hours. There has been some fluctuation in its latest trading range.
The overall trend is bearish, with XRP having traded lower from its highs in the last week. Currently, it is trading below its 7-day and 30-day moving averages.
| Metric | Value |
|---|---|
| Price | $1.3539 |
| RSI (14) | 43.14 |
| 7 Day SMA | $1.3611 |
| 30 Day SMA | $1.3981 |
| MACD Line | -0.0088 |
| Signal Line | $1.37 |
| Histogram | -45.3437 |
However, the latest candlestick patterns on the chart indicate that the price is moving around the levels with the RelicusRoad signal line acting as a visual guide for the direction of the trend.
The RSI is at 43.14. This suggests that the asset has low momentum and is likely to move sideways or even up slightly. The MACD is slightly negative at -0.0088. The signal line is at $1.37 with a negative histogram at -45.3437. This suggests that the asset is in a mild downward trend.
The XRP chart also shows that the signal line at $1.37 aligns with the current resistance level, which has been capping upside moves.
XRP Price Prediction For Today
For the rest of today, XRP price is more likely to trade in a slightly higher to sideways range. A constructive intraday shift would come if price reclaims the 7-day SMA around $1.36 and RSI pushes back above 45.
 Source: TradingView.com
With bearish momentum still present on the daily chart, a break below the $1.33 level is possible but not highly likely today.
Given this setup, short upward moves can still happen, though they may fade if the broader crypto market does not turn clearly risk on.
One level stands out as especially important. The resistance around $1.37 is very strong, and it needs to break for any further retracement. The support around $1.33 and $1.35 is still very solid, and the current momentum of the XRP price does not look like it will go lower than that.
Read Also: Where Is Cardano (ADA) Price Headed This Week?
Jupiter (JUP) Price Hovers Near Lows With Persistent Bearish Pressure
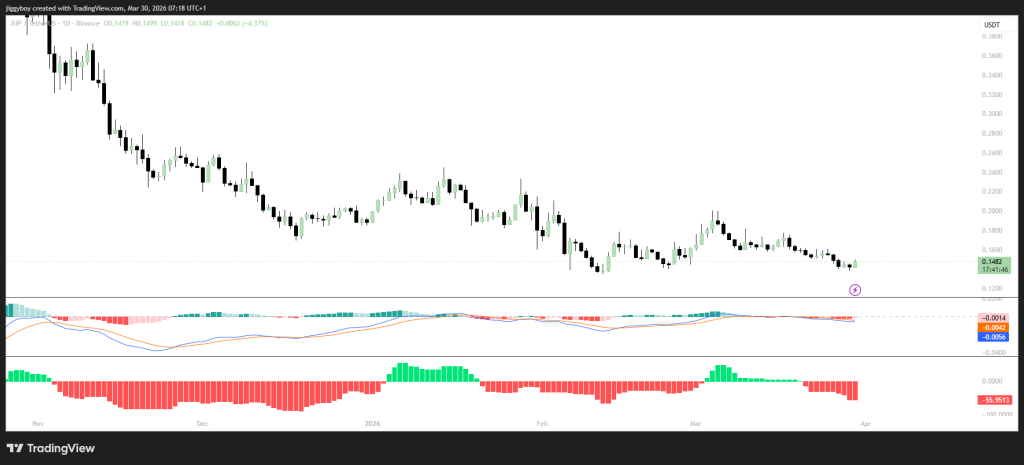
Jupiter is sitting around $0.148, and not much has changed in the past day. It’s basically just moving sideways.
People aren’t really rushing in either, trading activity is calm, like everyone is just watching and waiting to see what happens next.
The JUP price has lost huge ground over the past month, which places it in a prolonged downtrend. The token has dropped from higher levels near $0.30 and now sits near multi-week lows.
| Metric | Value |
|---|---|
| Price | $0.1481 |
| RSI (14) | 42.05 |
| 7 Day SMA | $0.1482 |
| 30 Day SMA | $0.1626 |
| MACD Line | Negative |
| Signal Line | $0.15 |
| Histogram | -55.9513 |
However, technical indicators show that bearish momentum remains in control. RSI sits near 42.05, which places JUP in bearish territory but not yet oversold. The recent candlestick patterns observed in the attached chart also reflect the continued bearishness with no signs of reversal.
The price is hovering around the critical support level of the 7-day SMA at around $0.1482. The 30-day SMA is at around $0.1626, which is significantly above the current levels and would be a formidable resistance level to cross.
The MACD is still in the red zone with the signal line at $0.15 and the histogram at -55.9513. That shows that bearish pressure remains huge even if the trend has not accelerated sharply lower in recent sessions.
 Source: TradingView.com
However, JUP price looks bearish for today, with limited chance of a meaningful recovery. Price may continue to trade near the $0.148 level or drift slightly lower if current conditions hold.
Support near $0.144 remains critical. A fall below this region could take the price even further down to $0.14 or even below. A rise above the 7-day SMA and the $0.15 signal line is required to indicate any positive changes in the price’s momentum; however, this is highly unlikely to happen today.
The above chart indicates that the price of the Jupiter token has experienced a sharp fall in the recent past and is now trying to build up after the fall.
Subscribe to our YouTube channel for daily crypto updates, market insights, and expert analysis.
The post Crypto Price Prediction for Today, March 30: Ethereum (ETH), XRP, Jupiter (JUP) appeared first on CaptainAltcoin.
You May Also Like

Chorus One and MEV Zone Team Up to Boost Avalanche Staking Rewards

NYDFS Mandates Blockchain Analysis for Banks’ Digital Asset Offerings


