

Toncoin braces for $80M token unlock this week: will TON price crash further?
Toncoin faces an $80 million token unlock on October 23. Can the TON price withstand the pressure?
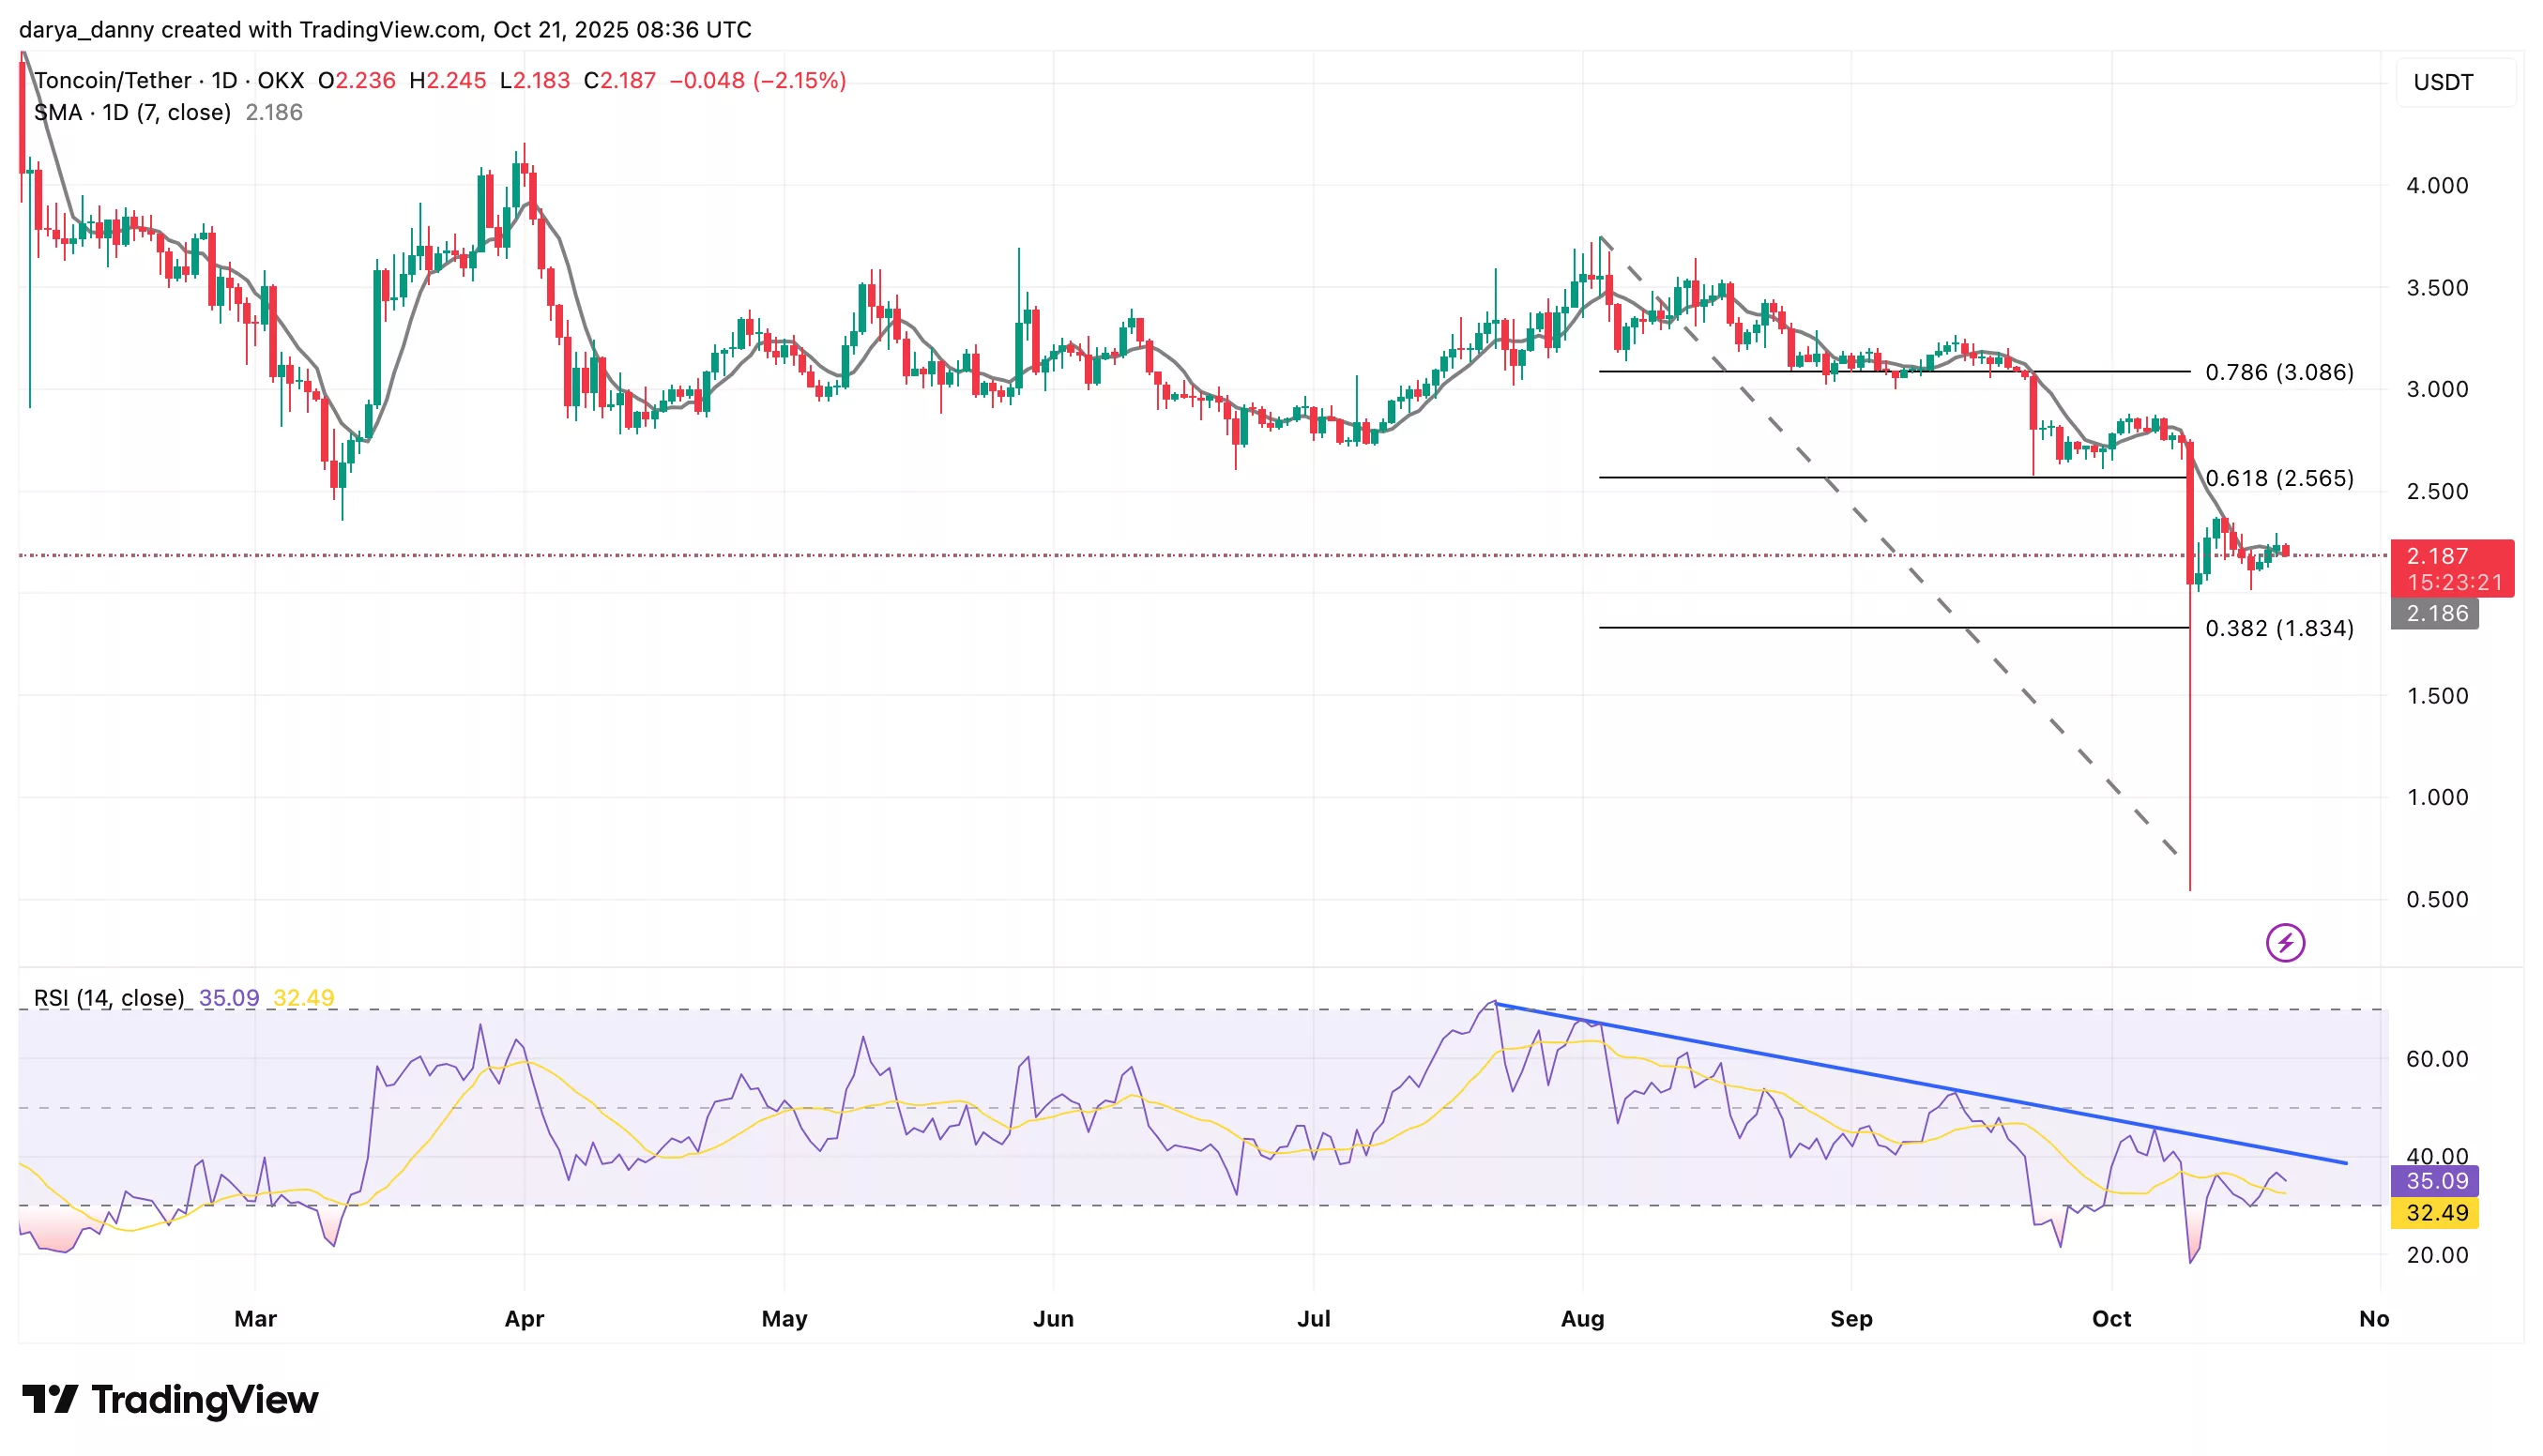
- TON price failed to reclaim the $2.50 zone after rebounding from the flash crash to $0.54 on October 10, with the level now acting as major resistance.
- With an $80 million unlock on October 23, TON risks a drop toward $1.83 or even $1.50 if selling pressure intensifies.
Toncoin (TON) price has recently broken below a critical support level at $2.50-$2.55, which is aligned with the 0.618 Fib, a zone that had held firm for months. The breakdown occurred on October 10, coinciding with a massive market liquidation event that wiped out nearly $19 billion in leveraged positions across the crypto market. During that session, TON price plunged from an opening price of $2.74 to as low as $0.54, marking an 80% intraday crash before quickly recovering.
Following the liquidation cascade, TON price staged a brief technical rebound, but momentum has since faded. TON is now consolidating above the new short-term support around $2.00, trading at $2.19 at press time. The former support at $2.50 has now flipped into major resistance.
TON price post-unlock outlook
With an $80 million unlock set for October 23, TON’s chances of reclaiming that resistance as support are not looking good. The RSI continues to track below its long-term descending trendline that began in late July. Each rally attempt since then has resulted in a lower RSI high, signaling that momentum remains firmly in bearish territory. At present, RSI sits near 35, showing weak recovery and limited buying conviction.
If buying pressure fails to strengthen, a rejection near the $2.50 resistance zone could trigger a renewed decline toward the next Fibonacci support around $1.83. A break below that level would further confirm the bearish continuation pattern, potentially setting the stage for a deeper retracement toward the $1.50 region.
You May Also Like

Privacy coins lead crypto rally as 80% break $100M market cap in 2026

Wormhole Unleashes W 2.0 Tokenomics for a Connected Blockchain Future
