

XRP, Bitcoin Now In “Good Buy Zone,” Says Analytics Firm
On-chain analytics firm Santiment has revealed how Bitcoin, XRP, and other cryptocurrencies have dropped into a “buy zone” on a popular metric.
MVRV Ratio Shows High Degree Of Short-Term Pain In Bitcoin & Altcoins
In a new post on X, Santiment has discussed how the various assets in the cryptocurrency sector are looking based on the 30-day MVRV Ratio. The Market Value to Realized Value (MVRV) Ratio is an on-chain indicator that measures the ratio between the market cap and Realized Cap for a given coin.
The Realized Cap here refers to a capitalization model that calculates the asset’s total value by assuming the value of each individual token is equal to the price at which it was last transacted on the blockchain. In short, what this model captures is an estimation for the amount of capital that BTC investors as a whole have invested into the cryptocurrency. The usual market cap, on the other hand, represents the amount holders are carrying today.
When the value of the MVRV Ratio is greater than 1, it means the market cap is greater than the Realized Cap. In other words, the overall network is in a state of profit. On the other hand, an indicator below this threshold implies the dominance of losses among investors.
In the context of the current topic, the version of the MVRV Ratio that’s of interest is the 30-day one, tracking the profit-loss balance of the traders who purchased their coins within the past month.
Below is the chart for the metric shared by Santiment that shows the trend in its value for five major cryptocurrencies: Bitcoin, XRP, Ethereum, Chainlink, and Cardano:
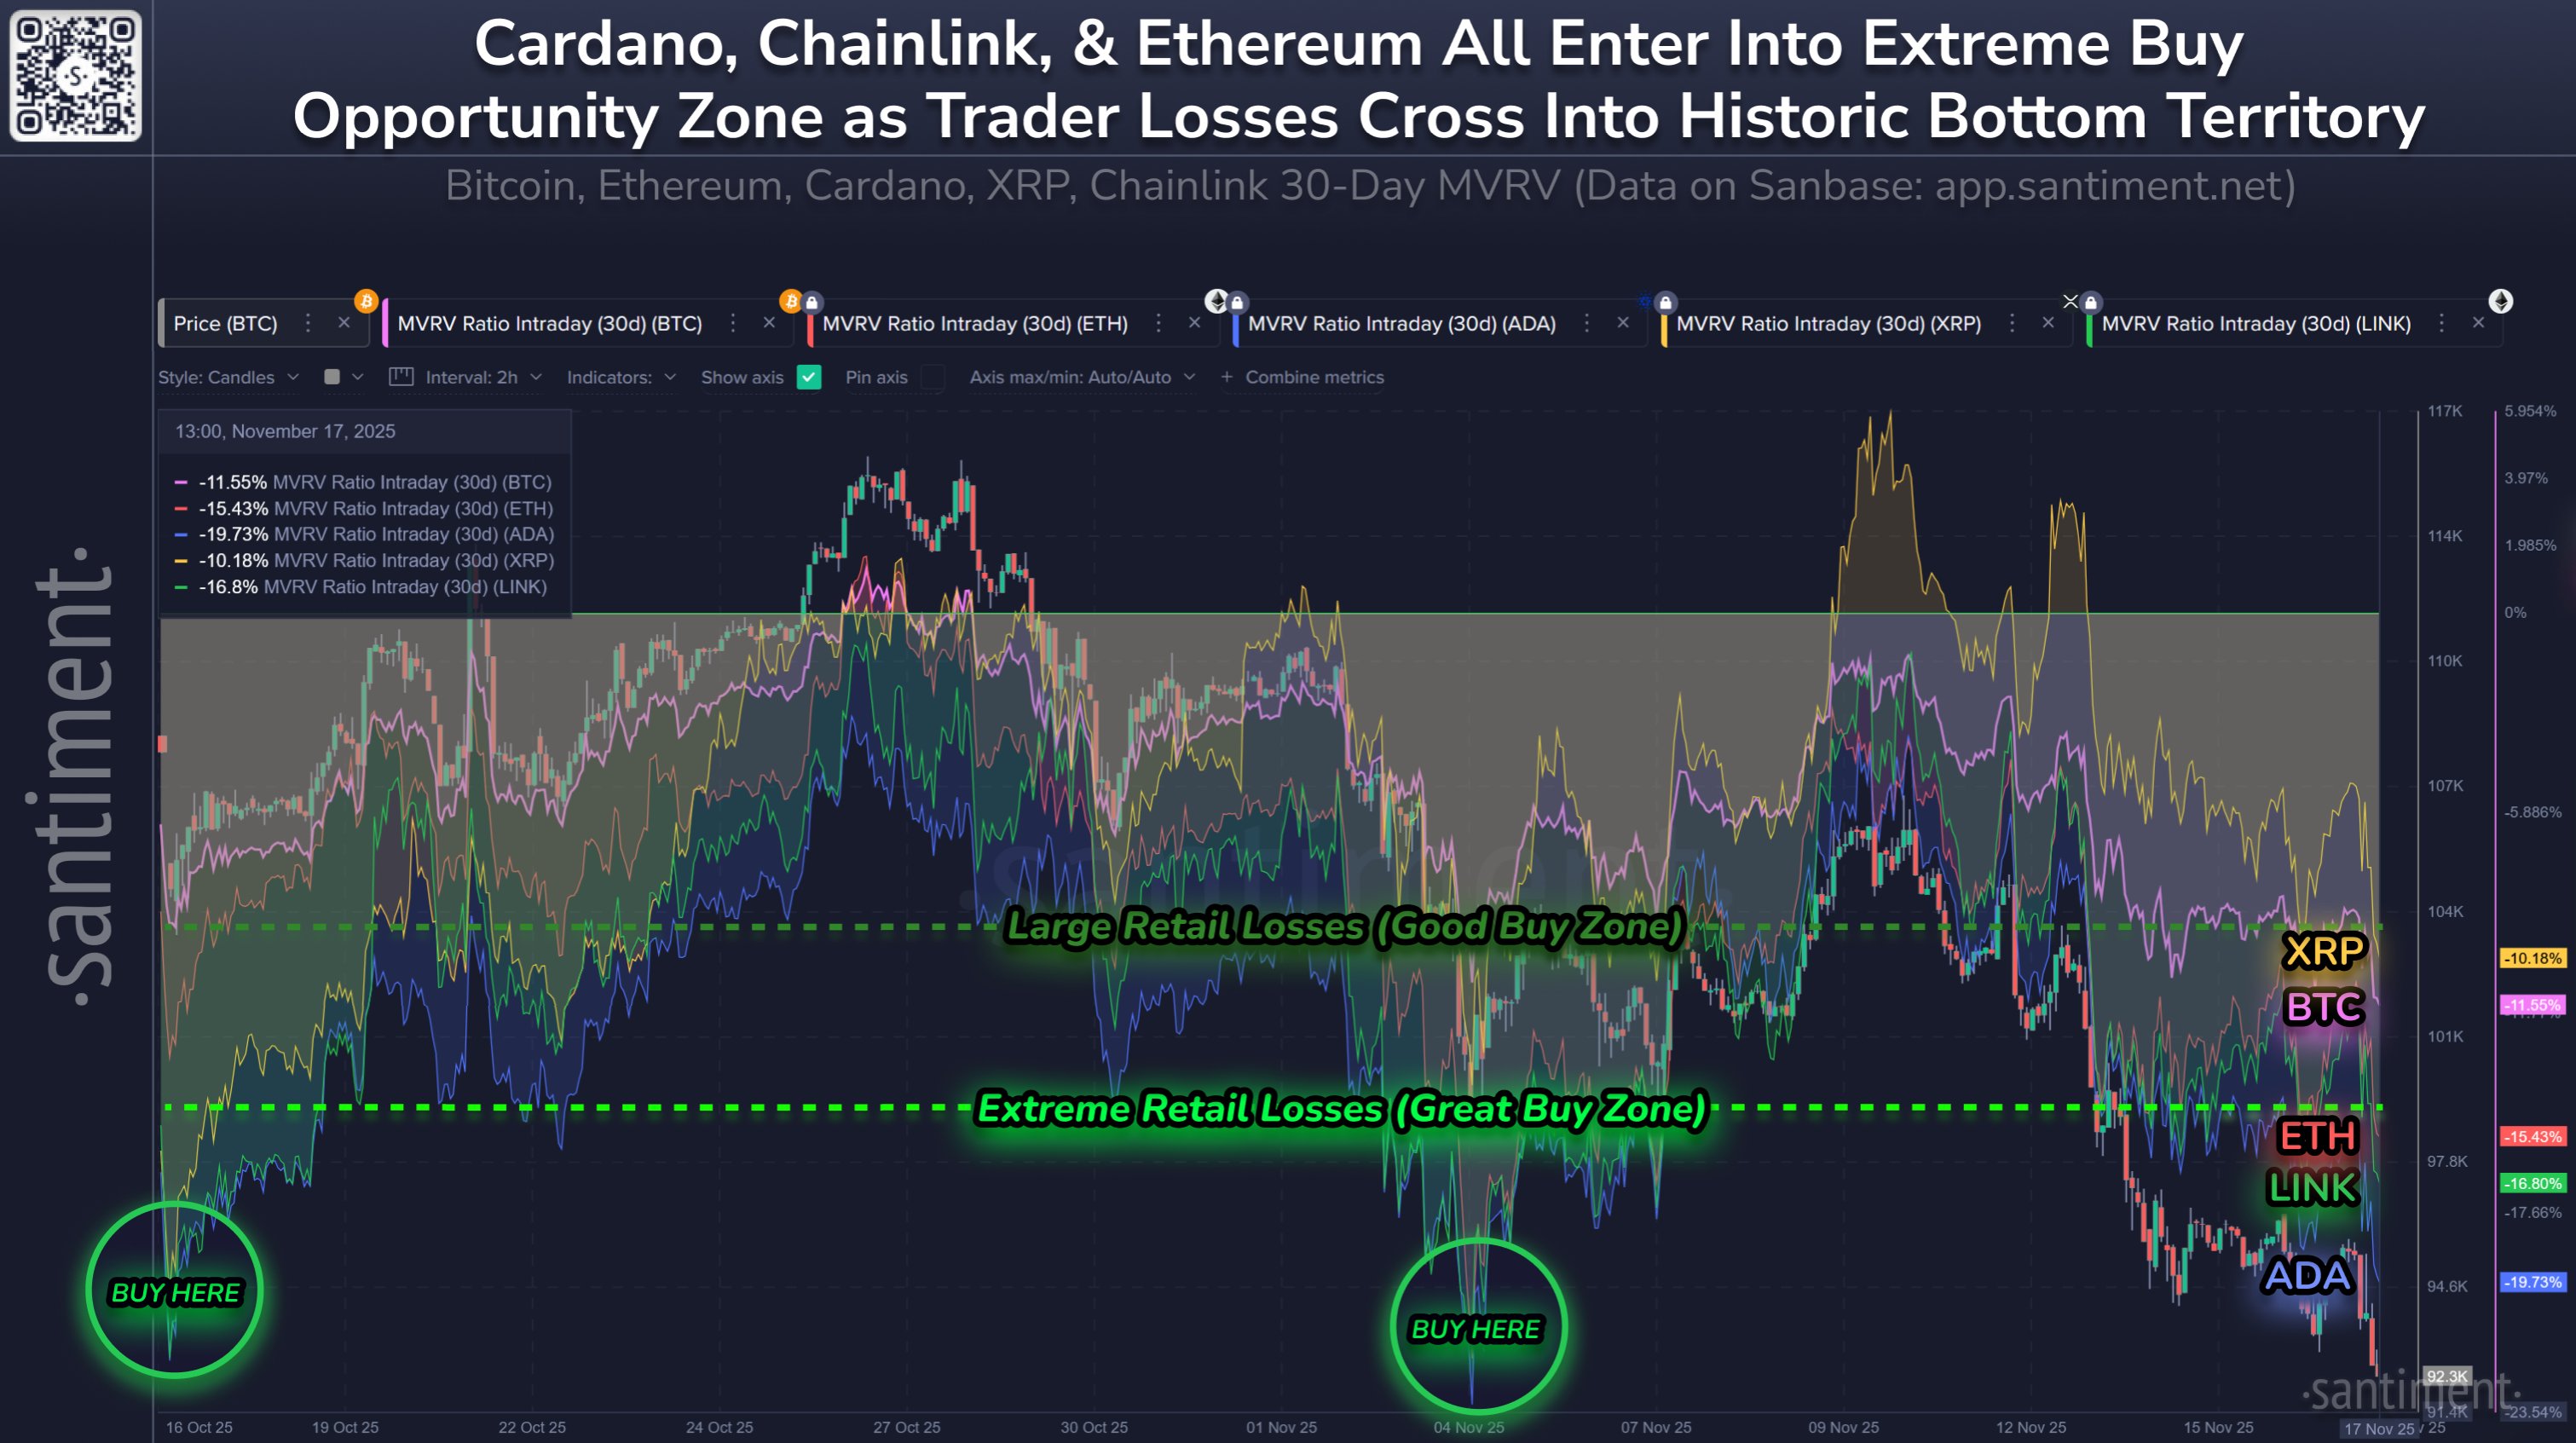
As is visible in the graph, the 30-day MVRV Ratio has witnessed a plunge recently as the sector has gone through a bearish shift. Recent Bitcoin buyers are now about 11.5% underwater, while XRP ones are around 10.2%. Both of these are beyond the threshold that the analytics firm classifies as the boundary for a “good buy zone.”
The 30-day investors have suffered even worse losses in the case of Ethereum, Cardano, and Chainlink, being down 15.4%, 19.7%, and 16.8%, respectively. All of these fall inside Santiment’s “extreme buy zone.”
“In a zero sum game, buy assets when average trade returns of your peers are in extreme negatives,” noted the analytics firm. “The lower MVRV’s go, the higher the probability is of a rapid recovery.”
It now remains to be seen whether market pain has been enough for XRP and others to cause a market rebound, or if more drawdown is coming.
XRP Price
At the time of writing, XRP is floating around $2.18, down more than 11% over the last week.
You May Also Like

Will US Banks Soon Accept Stablecoin Interest?

ArtGis Finance Partners with MetaXR to Expand its DeFi Offerings in the Metaverse
