Risk-off-turul ja madalama survega Bitcoin on täna aeglustumas./

The market picture shows a corrective context within a broader bull market, where Bitcoin today is moving in a risk-off scenario but with initial signs of slowing down the bearish pressure.
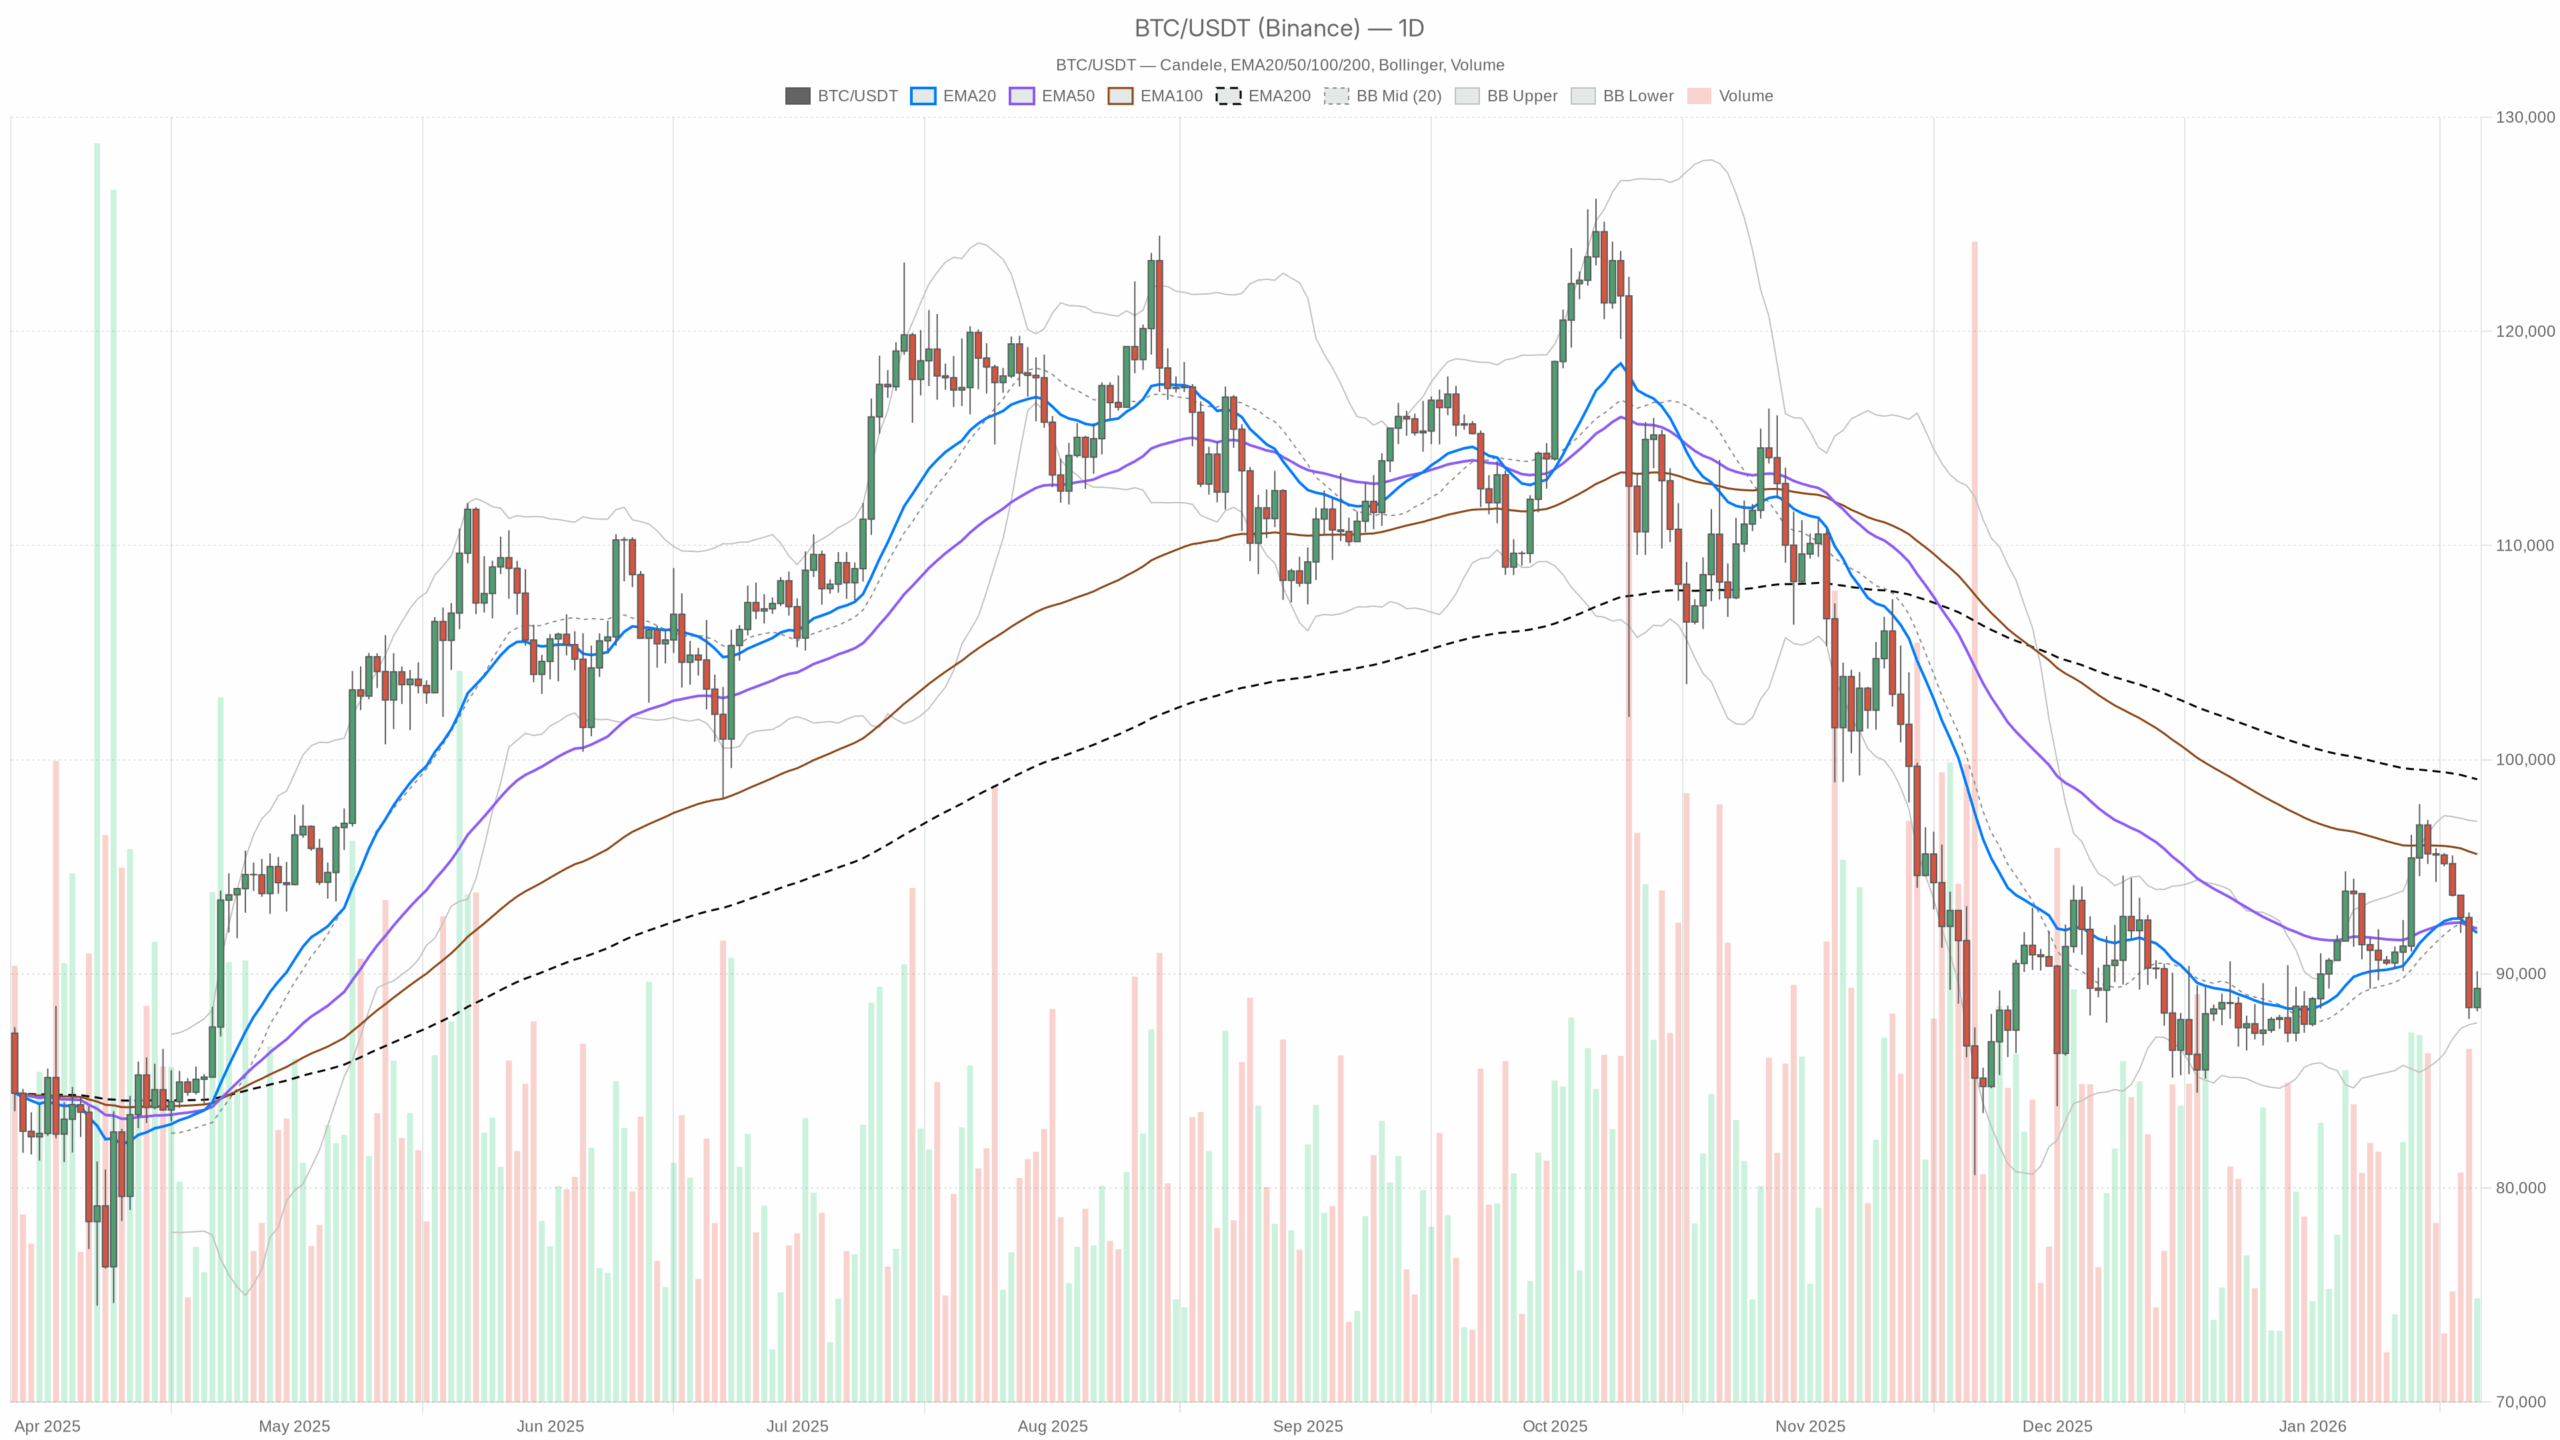 BTC/USDT — daily chart with candlesticks, EMA20/EMA50 and volume.
Main scenario (D1): bearish bias, but no capitulation
On the daily timeframe, Bitcoin is trading around 89,318 USDT, slightly below the central pivot at 89,229. Technically, this is a fragile equilibrium zone, yet still in the lower half of the range from recent weeks, close to the lower band of Bollinger.
RSI daily (14) – 42.7
The daily RSI stands at 42.7, thus below the neutral level but far from oversold territory.
Practical reading: the pressure is still on the sellers’ side, but we’re not in an extreme oversold situation. There’s room, in theory, both for another bearish leg and for a technical rebound without first exhausting the selling pressure.
MACD daily – negative momentum but not accelerating
MACD D1 values: line 437.8, signal 934.8, histogram -497.
Practical reading: the MACD is below the signal line, and the negative histogram confirms that bearish momentum remains dominant. However, we don’t have a recent spike in the negative value. We’re in a phase where short pressure is present, but it’s not increasing violently. It’s more of a steady pressure than a panic sell-off.
EMA (20/50/200) daily – price crushed below all averages
- EMA 20: 91,915 USDT
- EMA 50: 92,121 USDT
- EMA 200: 99,086 USDT
- Price: 89,318 USDT
Practical reading: the price is below all three averages, with the 20 and 50 almost flattened and just above the price, while the 200 remains much higher. This is an asset with a medium-term corrective structure. The long-term trend formally remains bullish above the 200, but the current cycle is dominated by sellers. Moreover, the fact that 20 and 50 are close indicates a strong technical resistance area between 91–92k.
Bollinger Bands daily – price heading toward the lower band
- Mid band: 92,420 USDT
- Upper band: 97,126 USDT
- Lower band: 87,714 USDT
- Price: 89,318 USDT
Practical reading: Bitcoin is trading in the lower third of the channel, but not glued to the lower band. Here the message is clear: downside risk prevails, but we’re not seeing a breakdown of volatility downward. It’s a phase of compression or bearish drift. The lower band at around 87.7k becomes the first natural level where we can expect at least defensive attempts from buyers.
ATR daily (14) – “normal” volatility for a correction market
The 14-day ATR is around 2,302 USDT.
Practical reading: daily ranges are contained by Bitcoin standards during impulse phases. There’s no panic, no extreme violence in the movements. It’s more of a stepwise descent than a vertical fall. This makes immediate capitulation less likely, but also less likely a V-shaped reversal without some kind of volatility spike.
Pivot point daily – market hanging on the pivot
- Pivot (PP): 89,230 USDT
- Resistance R1: 90,209 USDT
- Support S1: 88,339 USDT
Practical reading: the current price is practically on the pivot, but within a defined daily bearish regime. As long as we stay below R1, around 90.2k, buyers don’t have intraday control over the short-term trend. S1 in the 88.3k area is the first logical step where we can test buyer strength. A clear breakout would open the way toward the lower Bollinger band.
Multi-timeframe confluence: weakness on the daily, but timeframes start to slow the decline
H1 – structural downtrend, but short momentum taking a slight breath
On the 1H, BTC is trading around 89,301 USDT, just below the EMA 20 (89,619) and well below the EMA 50 (90,827) and the EMA 200 (92,842). The regime is classified as bearish.
RSI H1 – 39.7
The hourly RSI at 39.7 confirms a phase of bearish pressure but not extreme.
Practical reading: sellers still in control, but not overshooting. There’s room for an intraday technical rebound, especially if a exhaustion pattern forms at the lows.
MACD H1 – first signs of bullish breathing
H1 values: line -498.6, signal -617.4, histogram +118.8.
Practical reading: both lines are still in negative territory, so the hourly trend remains bearish. However, the MACD line is above the signal line and the histogram has turned positive. Here the reading is important: short strength is slowing down and buyers are starting to counterbalance, at least in the short term. It’s not yet a bullish trend, but it’s a clear attempt at a rebound within a weak structure.
Bollinger Bands H1 and ATR
- Mid band: 89,344 USDT
- Upper band: 90,201 USDT
- Lower band: 88,486 USDT
- ATR H1: about 552 USDT
Practical reading: price near the middle band, after probably approaching the lower part of the channel. The average hourly range of around 500–600 dollars signals a lively market but not in mass liquidation mode. In practice, it’s a manageable downtrend with controllable ranges, not a flash crash.
Pivot H1
- PP: 89,261 USDT
- R1: 89,363 USDT
- S1: 89,199 USDT
Practical reading: the price is hovering around the hourly pivot. The immediate 89.2–89.4k area is a micro-decision zone. Above R1, buyers can push an intraday rebound, while below S1, local selling pressure returns.
M15 – structure still fragile, but momentum nearly neutral
On the 15 minutes, BTC is at 89,299 USDT, essentially on the EMA 20 (89,330) and just below the EMA 50 (89,431), while the EMA 200 remains higher at 90,888. The regime is still labeled as bearish, but more out of inertia than actual strength.
RSI M15 – 48.4
The 15-minute RSI is at 48.4, practically neutral.
Practical reading: in the micro, the battle between buyers and sellers is balanced. There’s no longer the same short pressure seen in previous hours, consistent with the idea of a market trying to stabilize itself.
MACD M15 – flat and slightly negative
M15 values: line -34.1, signal -30.1, histogram -4.
Practical reading: momentum slightly negative but without strong directionality. It’s a phase of sideways consolidation within a higher-timeframe bearish trend. Typical context where the market decides whether to turn the hourly rebound into something more serious or just a brief pause before a new plunge.
Bollinger Bands and pivot M15
- Mid band: 89,328 USDT
- Upper band: 89,658 USDT
- Lower band: 88,998 USDT
- PP: 89,305 USDT
- R1: 89,317 USDT
- S1: 89,287 USDT
Practical reading: price glued to the middle band and the pivot. It’s a pure very short-term balance market, perfect for fine-tuning entry and exit levels, but lacking directional edge when taken alone. The decision needs to be anchored to higher timeframes, which remain bearish.
Sentiment, macro crypto and flows: high fear but not lack of interest
The Crypto Fear & Greed Index at 24 (Extreme Fear) reflects a market where many retail participants are reducing risk or have already been hit by the correction. At the same time, recent data showing strong inflows into Bitcoin ETFs, the highest since October according to Bloomberg, paints an interesting picture. Institutions are gradually coming back on the weakness, while overall sentiment remains gloomy.
This divergence between positive institutional flows and the price still below averages is typical of slow accumulation phases, but should be taken with caution. ETF flows can support the downside, but they don’t necessarily reverse the trend immediately.
The crypto market cap is falling with rising volumes, around 32%, indicating an active risk-off phase. Positions are being closed, stop losses are triggered, but there are also strong hands willing to absorb. It’s not a liquidity desert.
Bullish scenario for Bitcoin today
The bullish scenario starts from one fact: on the daily, the trend remains weak, so any long hypothesis is either counter-trend or, at best, looking for a corrective rebound.
What should happen to give strength to buyers
A sequence of confirmations across multiple timeframes is needed to give substance to a credible recovery.
1. Defending nearby daily supports
The key levels are:
- Daily S1 around 88.3k
- Lower Bollinger band around 87.7k
As long as these hold and the lows aren’t broken with explosive volumes, the market keeps the door open for a rebound. An ascending low pattern on H1 starting from this area would be the first constructive signal.
2. Recovering the 90–92k area
This is the real battleground:
- R1 daily is around 90.2k
- EMA 20 and 50 D1 are between 91–92k
- Mid band of Bollinger is around 92.4k
A recovery and holding above 92k with hourly and then daily closes would be an important change of tone. We’d move from a simple technical rebound to a potential resumption of the medium-term bullish trend. That’s when we’d start talking about a short squeeze on late bears.
3. Reversal signals on indicators
- RSI D1 returning steadily above 50, signaling a return of buyer strength.
- MACD D1 reducing the negative histogram and approaching the bullish crossover.
- Price leaning above the EMA 20 D1 instead of below.
What invalidates the bullish scenario
The short-term bullish scenario is essentially put on hold if certain key conditions occur.
- BTC decisively breaks through 88k–87.7k, i.e., S1 and the lower band, with a sharp increase in volumes and expanding daily ATR.
- The RSI D1 falls steadily below 35–30, signaling an acceleration of short momentum.
In that case, we’re no longer talking about an imminent oversold rebound, but a full-fledged bearish leg within the medium-term cycle.
Bearish scenario for Bitcoin today
The bearish scenario is currently the main one on the D1: price below 20, 50 and 200 EMAs, RSI below 50, negative MACD, regime classified as bearish.
What sellers would like to see
1. Clean break of 88k–87.7k
Here passes the lower band of Bollinger and a short-term support. A descent with hourly and then daily closes below this area, accompanied by a rising daily ATR, would open space for deeper bearish extensions. We don’t have precise next levels from the data, but logically, that’s where many long stop losses start accumulating.
2. Inability to regain the 90–92k zone
Every rebound that stalls below:
- R1 D1, around 90.2k
- EMA 20 and 50 D1, between 91–92k
would be read as a simple sell-the-rally by bearish traders. A succession of descending highs between 90 and 92k on H1 would be an ideal context to keep pressing downward.
3. Indicators confirming the trend
- RSI D1 remaining steadily below 45.
- MACD D1 with a histogram remaining widely negative or further expanding.
- Price continuing to bounce against the EMA 20 D1 as dynamic resistance.
What invalidates the bearish scenario
The short-term or composite bearish scenario would lose strength if structural recovery signals emerged.
- BTC closing several consecutive daily sessions above 92k, regaining EMA 20 and 50.
- The RSI D1 returning steadily above 50.
- MACD D1 starting to show a clear recovery, with the histogram approaching zero.
In that context, the dominant narrative would shift from ongoing correction to potentially finished correction.
How to read Bitcoin today in terms of positioning
To summarize the market logic, different timeframes offer complementary indications and help structure positioning.
- Daily: bearish bias, orderly correction, no panic.
- H1: still short-dominant, but with rebound signals building.
- M15: pure balance, useful only for entry and exit timing, not for direction.
Those watching Bitcoin with a multi-day perspective see a corrective trend that’s not yet exhausted. Intraday traders, on the other hand, are starting to spot opportunities on both sides. On one hand, short positions on rebounds as long as the daily remains below 20 and 50 EMAs. On the other hand, tactical long attempts near clear supports, 88–87.7k, always with tight stops because the higher trend hasn’t reversed yet.
The current volatility, measured by the ATR, allows working the levels without exposing yourself to extreme spikes. However, the Extreme Fear sentiment implies that market emotional reactions can be quick when important news or technical breaks arrive.
The central point: this isn’t an all-in context in either direction. It’s a market to manage with discipline, clear levels and realistic expectations. The macro picture remains constructive for Bitcoin in the long term, but today the short-term structure still rewards those who think in terms of risk management rather than making a one-way bet on Bitcoin today.
If you want to monitor markets with professional charting tools and real-time data, you can open an account on Investing using our partner link:
Open your Investing.com account
This section contains a sponsored affiliate link. We may earn a commission at no additional cost to you.
This text is purely informative and editorial in nature and does not constitute financial advice, public savings solicitation or personalized investment recommendation in any way. Cryptocurrency markets are highly volatile and involve a high risk of loss. Anyone trading on these markets is personally responsible for their own decisions and should always carefully evaluate objectives, time horizon and risk tolerance.


Teile võib meeldida ka

Naeratus kandidaadi üleüleliikumise reklaamis, kus kasutatakse leiba, mida pühade ajal ei tohi süüa: „OMG!“

Bitcoini suured kalad kaotasid esimeses kvartalis 30,9 miljardit USA dollarit, kuna päevased realiseeritud kaotused said 337 miljonit USA dollarit