L'IA pour la stratification des risques : les modèles DL multimodaux offrent un pronostic amélioré pour l'embolie pulmonaire
Table des liens
Résumé
- Introduction
- Méthodes
- Résultats
- Discussion
- Conclusions, Remerciements et Références
5. Conclusions
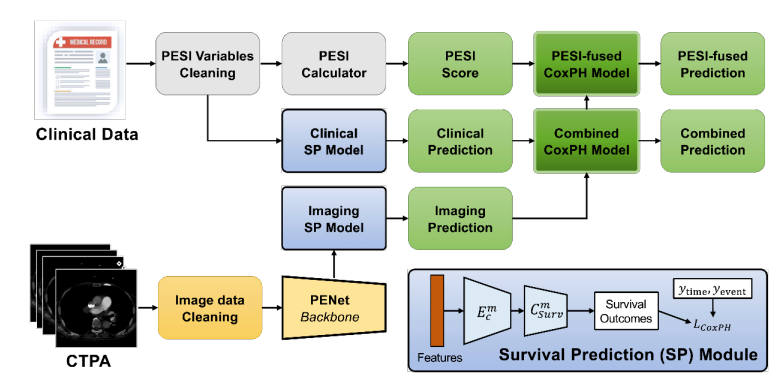
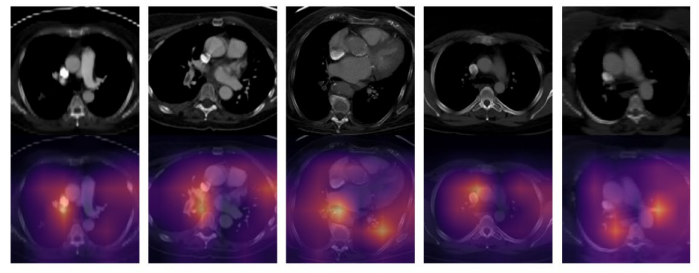
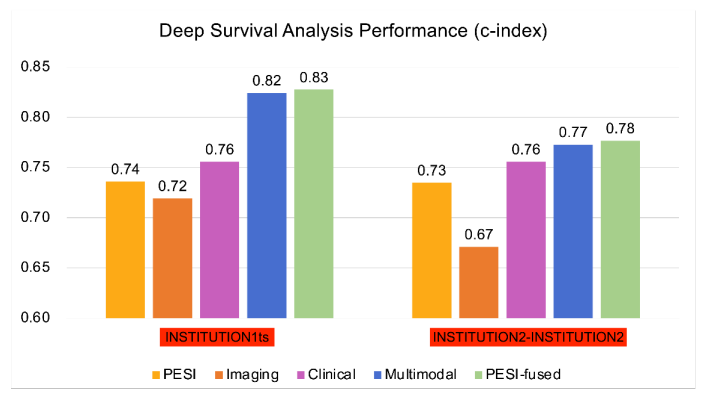
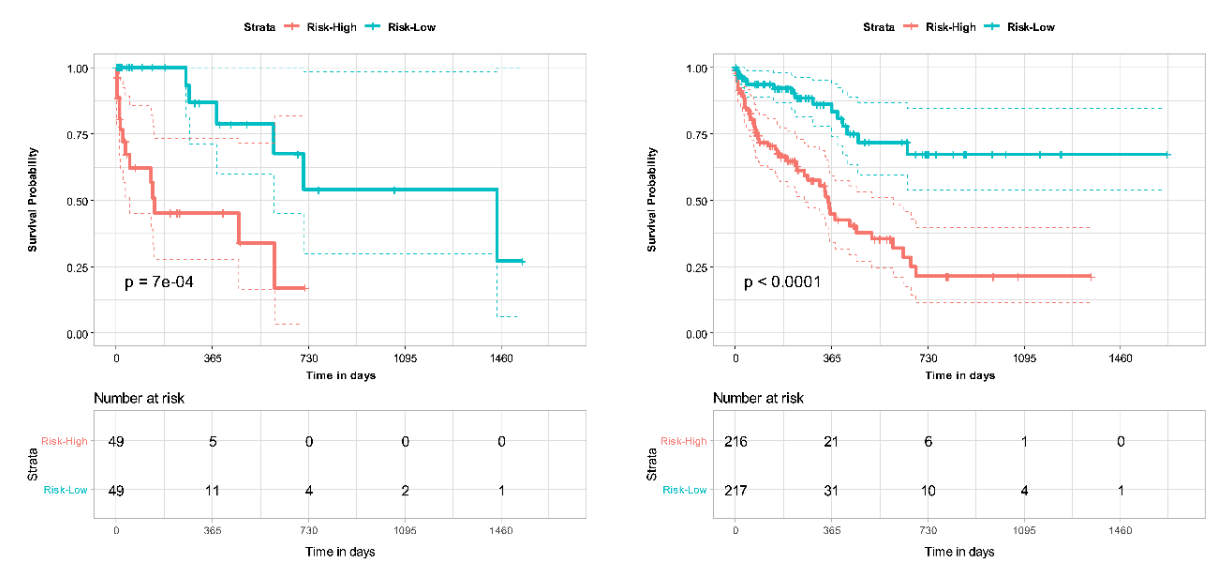
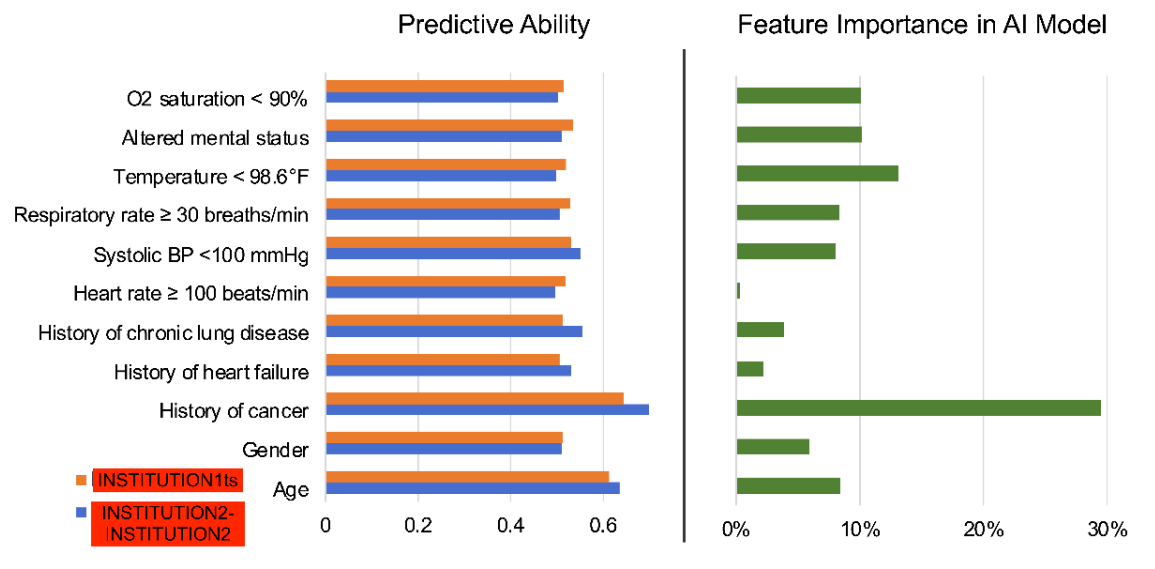
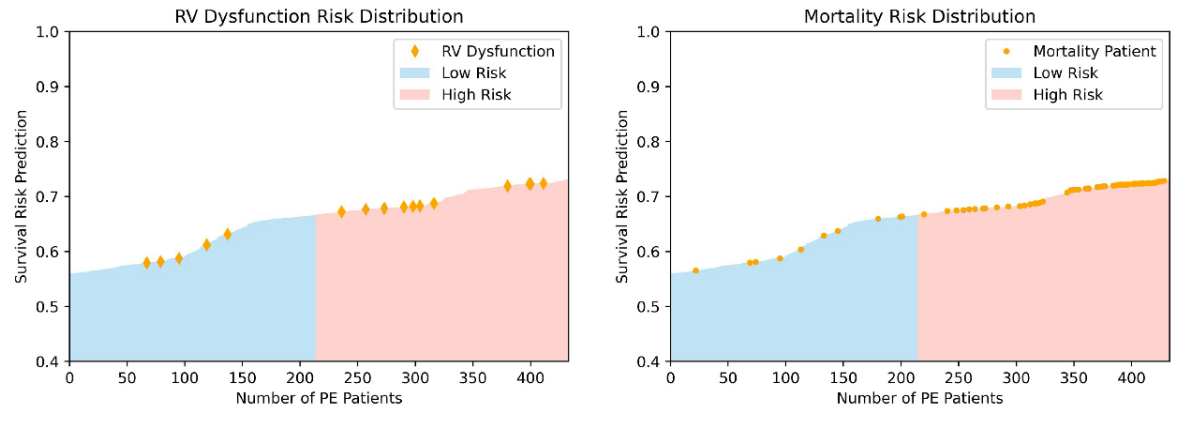
Les modèles DL multiomiques basés sur des caractéristiques CTPA combinées et des variables cliniques ont démontré une performance améliorée par rapport au score PESI seul pour la prédiction de la mortalité dans l'EP. L'ajout du PESI au modèle multimodal n'a démontré qu'une amélioration marginale des performances, illustrant que les modèles basés sur l'IA sont suffisamment capables de prédire la survie. Les modèles multimodaux ont également amélioré les performances par rapport au PESI seul dans l'estimation du risque de mortalité à 30 jours. Grâce à l'analyse NRI, il a été démontré que les données cliniques et d'imagerie contribuent indépendamment à l'amélioration des performances du modèle multimodal. Ces résultats démontrent la force d'un modèle DL multimodal par rapport à la norme clinique actuelle du PESI, transformant le pronostic en un processus intelligent qui intègre davantage d'informations cliniques et d'imagerie. De plus, nous avons démontré la concordance de notre modèle avec les indicateurs cliniques de mortalité, tels que la dysfonction VD. Une analyse plus approfondie peut éclairer davantage la connexion entre divers facteurs de risque et la mortalité chez les patients atteints d'EP, et comment ces informations peuvent être exploitées pour le développement de modèles de prédiction de survie. Cependant, les avantages de notre modèle ne peuvent être confirmés que par une validation supplémentaire sur des ensembles de données plus vastes et plus diversifiés, ainsi que par des tests prospectifs des modèles développés.
\ Notre étude souligne l'utilité des modèles basés sur le DL dans le pronostic et la stratification du risque chez les patients atteints d'EP. L'IA a le potentiel d'améliorer le flux de travail clinique pour les radiologues et les cliniciens en fournissant des informations diagnostiques et pronostiques rapides et précises. En offrant une stratification des risques opportune mais précise pour les patients atteints d'EP, l'IA peut offrir un avantage substantiel aux patients et aux prestataires en informant la prise de décision clinique, améliorant potentiellement les résultats pour les patients.
Remerciements
Aucun.
Références
-
Beckman MG, Hooper WC, Critchley SE, Ortel TL. Venous thromboembolism: a public health concern. American journal of preventive medicine. 2010;38(4):S495-S501.
\
-
Lewis AE, Gerstein NS, Venkataramani R, Ramakrishna H. Evolving management trends and outcomes in catheter management of acute pulmonary embolism. Journal of Cardiothoracic and Vascular Anesthesia. 2022;36(8):3344-3356.
\
-
Goldhaber SZ, Bounameaux H. Pulmonary embolism and deep vein thrombosis. The Lancet. 2012;379(9828):1835-1846.
\
-
Piazza G, Goldhaber SZ. Acute pulmonary embolism: part I: epidemiology and diagnosis. Circulation. 2006;114(2):e28-e32.
\
-
Aujesky D, Obrosky DS, Stone RA, et al. Derivation and validation of a prognostic model for pulmonary embolism. American journal of respiratory and critical care medicine. 2005;172(8):1041-1046.
\
-
Donzé J, Le Gal G, Fine MJ, et al. Prospective validation of the pulmonary embolism severity index. Thrombosis and haemostasis. 2008;100(05):943-948.
\
-
Ishwaran H, Kogalur UB, Blackstone EH, Lauer MS. Random survival forests. 2008;
\
-
Fox J, Weisberg S. Cox proportional-hazards regression for survival data. An R and S-PLUS companion to applied regression. 2002;2002
\
-
Katzman JL, Shaham U, Cloninger A, Bates J, Jiang T, Kluger Y. DeepSurv: personalized treatment recommender system using a Cox proportional hazards deep neural network. BMC medical research methodology. 2018;18(1):1-12.
\
-
Oren O, Gersh BJ, Bhatt DL. Artificial intelligence in medical imaging: switching from radiographic pathological data to clinically meaningful endpoints. The Lancet Digital Health. 2020;2(9):e486-e488.
\
-
Weikert T, Winkel DJ, Bremerich J, et al. Automated detection of pulmonary embolism in CT pulmonary angiograms using an AI-powered algorithm. European radiology. 2020;30:6545-6553.
\
-
Huang S-C, Kothari T, Banerjee I, et al. PENet—a scalable deep-learning model for automated diagnosis of pulmonary embolism using volumetric CT imaging. NPJ digital medicine. 2020;3(1):61.
\
-
Huang S-C, Pareek A, Zamanian R, Banerjee I, Lungren MP. Multimodal fusion with deep neural networks for leveraging CT imaging and electronic health record: a case-study in pulmonary embolism detection. Scientific reports. 2020;10(1):22147.
\
-
Liu W, Liu M, Guo X, et al. Evaluation of acute pulmonary embolism and clot burden on CTPA with deep learning. European radiology. 2020;30:3567-3575.
\
-
Yao J, Zhu X, Zhu F, Huang J. Deep correlational learning for survival prediction from multi-modality data. Springer; 2017:406-414.
\
-
Vale-Silva LA, Rohr K. Long-term cancer survival prediction using multimodal deep learning. Scientific Reports. 2021;11(1):13505.
\
-
Meyer G, Vicaut E, Danays T, et al. Fibrinolysis for patients with intermediate-risk pulmonary embolism. New England Journal of Medicine. 2014;370(15):1402-1411.
\
-
Hofmanninger J, Prayer F, Pan J, Röhrich S, Prosch H, Langs G. Automatic lung segmentation in routine imaging is primarily a data diversity problem, not a methodology problem. European Radiology Experimental. 2020;4(1):1-13.
\
-
Harrell Jr FE, Lee KL, Califf RM, Pryor DB, Rosati RA. Regression modelling strategies for improved prognostic prediction. Statistics in medicine. 1984;3(2):143-152.
\
-
Leening MJ, Vedder MM, Witteman JC, Pencina MJ, Steyerberg EW. Net reclassification improvement: computation, interpretation, and controversies: a literature review and clinician's guide. Annals of internal medicine. 2014;160(2):122-131.
\
-
Kaplan EL, Meier P. Nonparametric estimation from incomplete observations. Journal of the American statistical association. 1958;53(282):457-481.
\
-
Grifoni S, Olivotto I, Cecchini P, et al. Short-term clinical outcome of patients with acute pulmonary embolism, normal blood pressure, and echocardiographic right ventricular dysfunction. Circulation. 2000;101(24):2817-2822.
\
-
Coutance G, Cauderlier E, Ehtisham J, Hamon M, Hamon M. The prognostic value of markers of right ventricular dysfunction in pulmonary embolism: a meta-analysis. Critical care. 2011;15:1-10.
\
-
Chaudhary K, Poirion OB, Lu L, Garmire LX. Deep learning–based multi-omics integration robustly predicts survival in liver cancer. Clinical Cancer Research. 2018;24(6):1248-1259.
\
-
Somani SS, Honarvar H, Narula S, et al. Development of a machine learning model using electrocardiogram signals to improve acute pulmonary embolism screening. European Heart Journal-Digital Health. 2022;3(1):56-66.
\
-
Tourassi GD, Floyd CE, Sostman HD, Coleman RE. Acute pulmonary embolism: artificial neural network approach for diagnosis. Radiology. 1993;189(2):555-558.
\
-
Soffer S, Klang E, Shimon O, et al. Deep learning for pulmonary embolism detection on computed tomography pulmonary angiogram: a systematic review and meta-analysis. Scientific reports. 2021;11(1):15814.
\
-
Elias A, Mallett S, Daoud-Elias M, Poggi J-N, Clarke M. Prognostic models in acute pulmonary embolism: a systematic review and meta-analysis. BMJ open. 2016;6(4):e010324.
\
-
Cahan N, Klang E, Marom EM, et al. Multimodal fusion models for pulmonary embolism mortality prediction. Scientific Reports. 2023;13(1):1-15.
Figure
\ 
\ 
\ 
\ 
\ 
\ 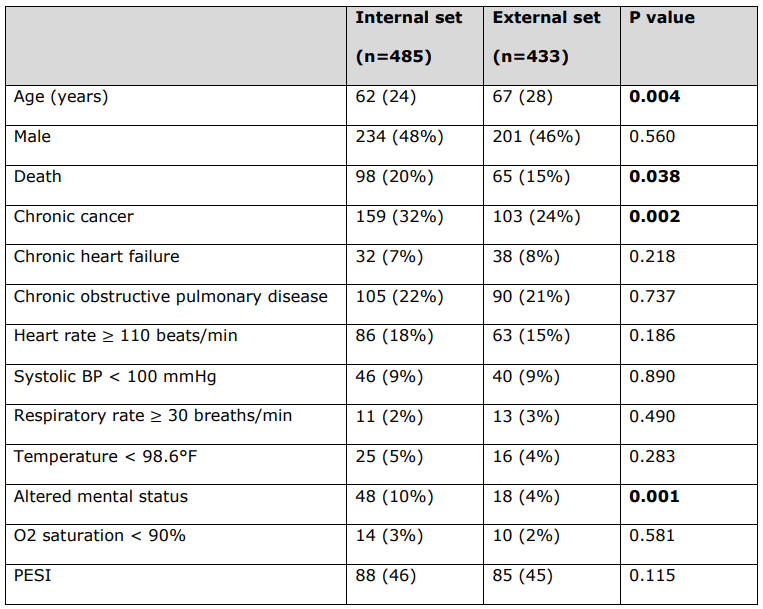
\ Caractéristiques détaillées des patients selon les variables cliniques PESI utilisées pour calculer le score PESI pour chaque patient.
\ Toutes les variables continues sont rapportées sous forme de médiane (intervalle interquartile), et toutes les variables catégorielles sont rapportées sous forme de nombre (%). Les valeurs p statistiquement significatives sont en gras (p < 0,05). Le statut de décès n'est pas une variable clinique PESI.
\ BP = Pression artérielle. PESI = Indice de sévérité de l'embolie pulmonaire.
\ 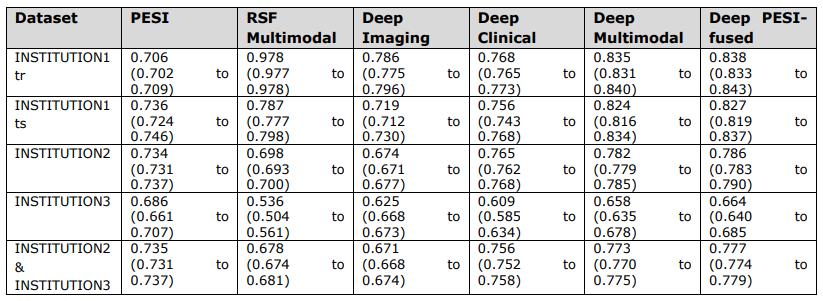
\ Valeurs globales de l'indice c et intervalles de confiance


Vous aimerez peut-être aussi

Le chatbot Claude pourrait recourir à la tromperie lors de tests de stress, selon Anthropic

La Blockchain Arc de Circle dévoile son plan pour lutter contre les menaces de l'informatique quantique