Silver Price Analysis: Plummets After Critical Trendline Break, Eyes $70 Target
BitcoinWorld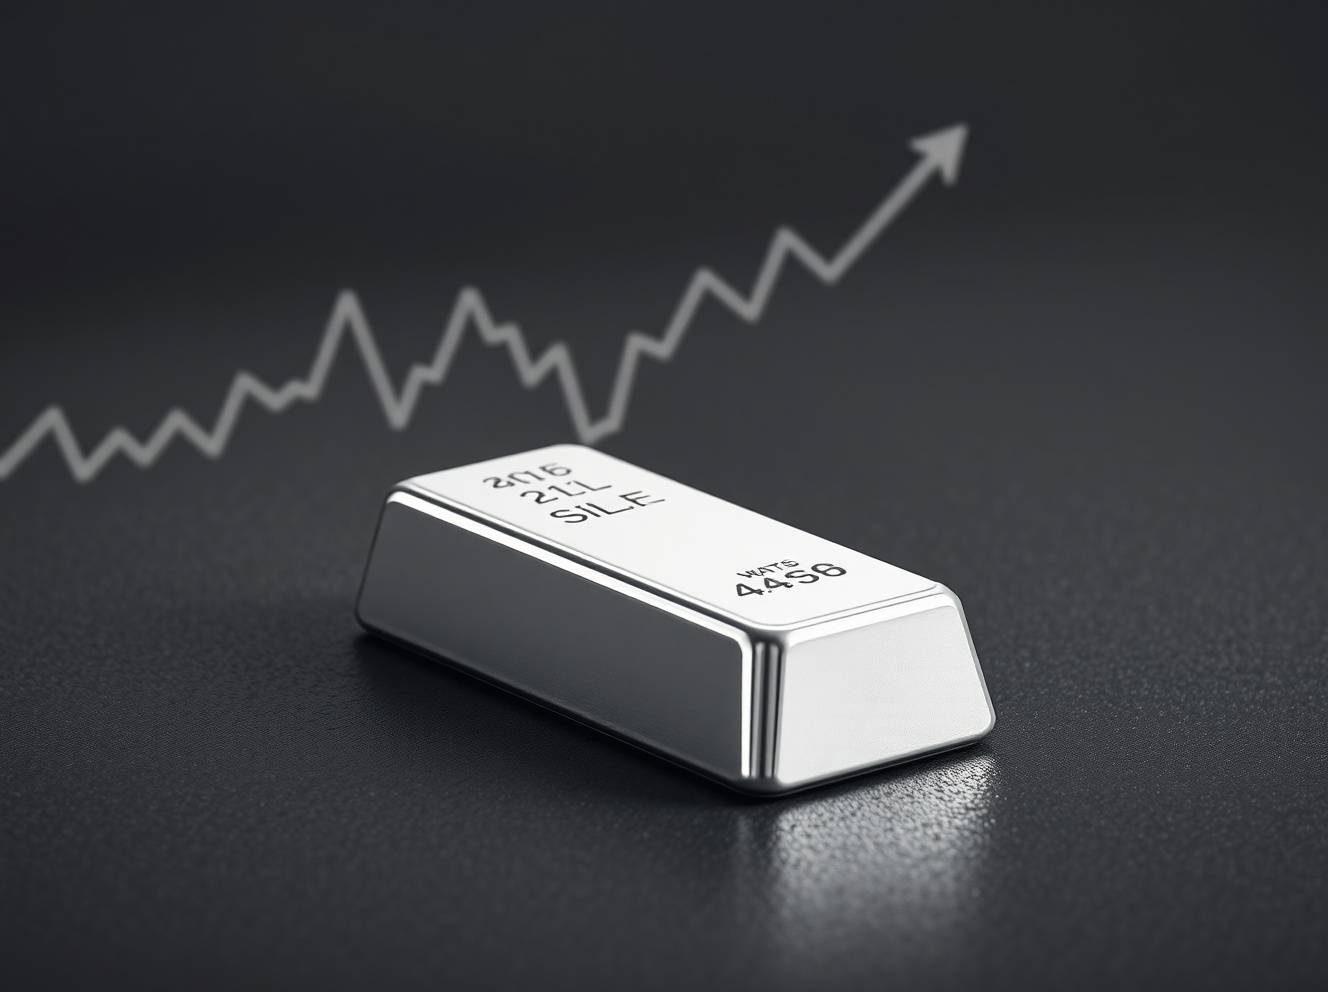
Silver Price Analysis: Plummets After Critical Trendline Break, Eyes $70 Target
Global silver markets witnessed a pivotal technical event this week as the spot price decisively broke below a crucial multi-month trendline, triggering a sharp sell-off that has analysts scrutinizing the $70 per ounce level. This significant movement, observed across major exchanges from New York to London, reflects a complex interplay of macroeconomic pressures and shifting investor sentiment in the precious metals sector.
Silver Price Analysis: Decoding the Technical Breakdown
The recent price action for silver represents a classic example of a technical breakdown. For several months, a clear ascending trendline, connecting a series of higher lows, provided dynamic support. However, on elevated volume, the price action sliced through this level. Consequently, this breach has activated a cascade of sell orders, primarily from algorithmic trading systems and momentum-based funds. Technical analysts now identify the previous support zone, around $28.50, as a new resistance area. Furthermore, key moving averages, including the 50-day and 200-day, have begun to exhibit a bearish alignment, adding to the downward pressure.
Key Technical Indicators and Their Signals
Several indicators corroborate the bearish shift. The Relative Strength Index (RSI) has plunged from neutral territory into oversold conditions, signaling intense selling pressure. Meanwhile, the Moving Average Convergence Divergence (MACD) histogram shows a deepening negative momentum. Trading volume during the break was notably higher than the 30-day average, confirming the move’s significance. Market participants are now closely monitoring Fibonacci retracement levels drawn from the last major swing high to identify potential support zones on the path toward the discussed $70 target, which represents a longer-term projection based on measured move calculations.
Fundamental Drivers Behind the Precious Metals Shift
While the charts illustrate the move, fundamental factors provide the context. The primary catalyst remains the shifting monetary policy landscape. Central banks, led by the Federal Reserve, have maintained a firm stance on interest rates to combat persistent inflation. Higher interest rates increase the opportunity cost of holding non-yielding assets like silver, making fixed-income alternatives more attractive. Simultaneously, a period of relative strength in the U.S. Dollar Index (DXY) has exerted additional downward pressure on dollar-denominated commodities. Industrial demand signals, a critical component for silver given its dual role as a monetary and industrial metal, have also shown signs of moderation in key sectors like electronics and photovoltaics, according to recent trade data.
- Monetary Policy: Hawkish central bank rhetoric suppresses speculative demand for metals.
- Currency Strength: A robust U.S. dollar makes silver more expensive for foreign buyers.
- Economic Manufacturing PMI reports influence industrial demand outlooks.
- Risk Sentiment: Shifts toward “risk-on” assets can divert capital from safe havens.
Historical Context and Market Psychology
Trendline breaks of this magnitude often lead to extended periods of price discovery. Historically, similar breakdowns in silver have resulted in volatile, high-magnitude moves as the market searches for a new equilibrium. The psychology of market participants plays a crucial role; the broken trendline transforms from a “buy-the-dip” zone into a “sell-the-rally” ceiling. This shift in market structure can lead to a vacuum of buying interest until prices reach a level perceived as fundamentally undervalued. Analysts often reference the 2011-2012 period and the 2020 post-pandemic volatility to model potential support clustering and investor behavior during such transitions.
Expert Analysis on the Path Forward
Market strategists emphasize a data-dependent approach. “The break is technically significant,” notes a senior commodities analyst from a major financial institution, “but its sustainability hinges on incoming macroeconomic data, particularly inflation prints and employment figures.” Another expert from a precious metals fund highlights the importance of physical market flows: “While paper markets are selling, we are monitoring physical silver ETF holdings and mint sales for signs of retail accumulation at lower prices, which could provide a floor.” These perspectives underscore that while the technical picture is bearish, fundamental supply-demand dynamics and macroeconomic shifts will ultimately dictate the trajectory toward any long-term price target.
Comparative Performance and Sector Impact
The sell-off has not been isolated to silver. The broader precious metals complex has faced headwinds, though with varying intensity. Gold, often seen as a more stable monetary metal, has shown relative resilience, causing the gold-to-silver ratio to widen. This ratio, a key metric for precious metals traders, indicates how many ounces of silver are needed to purchase one ounce of gold. A rising ratio suggests silver is underperforming gold, which can sometimes signal an eventual mean-reversion trade. Meanwhile, mining equities, represented by indices like the Philadelphia Gold and Silver Index (XAU), have experienced amplified volatility, typically exhibiting greater beta than the underlying metal.
| Asset | Weekly Change | Key Technical Level |
|---|---|---|
| Silver (Spot) | -8.2% | Broken Trendline Support |
| Gold (Spot) | -2.1% | Testing 100-Day MA |
| Platinum | -5.7% | Rangebound |
| Palladium | -4.3% | Multi-Year Low |
Conclusion
This silver price analysis confirms a major technical shift with the confirmed break of a key trendline, setting the stage for further potential downside with the $70 area emerging as a focal point for long-term charts. The move is fundamentally supported by a strong dollar and restrictive monetary policy. However, markets remain dynamic, and any softening in economic data or central bank tone could alter the trajectory. Investors and traders should monitor volume profiles, physical market indicators, and key macroeconomic releases for signals of stabilization or continuation in this new phase for silver. The coming weeks will be critical in determining whether this breakdown marks the beginning of a sustained bearish trend or a volatility spike within a larger consolidation pattern.
FAQs
Q1: What does a “trendline break” mean in silver price analysis?
A trendline break occurs when the price moves through a historically significant diagonal support or resistance line on a chart. In this case, silver broke below an ascending support line, which technical analysts interpret as a failure of the prior uptrend and a potential signal for further declines.
Q2: Why is the $70 price target significant?
The $70 target is derived from technical analysis methods like measured moves or long-term chart patterns. It represents a projected price level based on the magnitude of the previous trend and the current breakdown, not a fundamental valuation. It serves as a hypothetical area where the market might find significant support or encounter the next major technical hurdle.
Q3: How do interest rates affect the silver price?
Higher interest rates increase the yield on competing assets like government bonds. Since silver does not pay interest or dividends, its opportunity cost rises in a high-rate environment, making it less attractive to hold, which can lead to selling pressure.
Q4: Is now a good time to buy physical silver?
Investment decisions depend on individual strategy, risk tolerance, and time horizon. Some view significant technical breakdowns as buying opportunities for long-term holdings, while others wait for confirmed stability. Consulting a financial advisor and considering dollar-cost averaging are common approaches during volatile periods.
Q5: What should I watch to gauge the next move in silver?
Key indicators include the U.S. Dollar Index (DXY) strength, Federal Reserve policy statements, inflation data (CPI), physical investment demand (via ETF flows), and whether silver can reclaim any of its lost technical levels, such as the broken trendline which now acts as resistance.
This post Silver Price Analysis: Plummets After Critical Trendline Break, Eyes $70 Target first appeared on BitcoinWorld.


Potrebbe anche piacerti
MAGA congressman gets more than he bargained for from Jake Tapper: 'Guess I'm confused?'

Bitcoin, Gold, and U.S. Stocks Dive as Trump Pledges to Hit Iran ‘Extremely Hard’