Solana price risks drop to $75 as MACD forms bearish crossover
Solana price is showing signs of weakness as the MACD forms a bearish crossover, with price hovering just above a key support zone that could determine the next move.
- Solana price trades near $84.5 as MACD forms a bearish crossover, signaling weakening short-term momentum.
- Key support lies at $78–$75, with repeated tests raising the risk of a breakdown toward the $75 level.
- Declining ETF inflows, falling DEX volume, and exchange inflows point to weakening demand and rising sell pressure.
According to data from crypto.news, Solana (SOL) price was trading around $84.51 at press time on May 1, up roughly 1.7% over the past 24 hours. Over the past week, the token has moved within a relatively tight range between $79 and $92, reflecting a period of consolidation after a sharp decline earlier this year.
The asset remains under heavy pressure on higher timeframes, still down significantly from levels above $170 seen in late 2025. Price action has flattened in recent weeks, with lower volatility and limited directional follow-through.
When consolidation forms near key support after a downtrend, it often signals a continuation move if buyers fail to regain control.
Market structure suggests that buying pressure is gradually weakening. Institutional demand, which previously helped stabilize Solana, has started to fade. Data from SoSoValue shows monthly inflows into Solana-linked investment products have declined for six consecutive months, falling to around $38.69 million in April 2026, their lowest level since their launch.
On-chain data also shows persistent net inflows into exchanges throughout April, indicating that larger holders may be positioning to sell rather than accumulate.
At the same time, network activity has cooled. Total decentralized exchange volume on Solana has dropped sharply, falling more than 60% from $118 billion in early February to around $44 billion. Network fee generation has also declined by roughly 21%, reducing organic demand for SOL as gas.
Liquidity is also rotating elsewhere. Speculative capital that once flowed into Solana-based memecoins is increasingly shifting toward newer narratives such as AI-focused tokens on competing chains.
Solana price analysis
The daily chart shows Solana holding above a key horizontal support zone near $75, which aligns closely with a major Fibonacci level at $78.03.
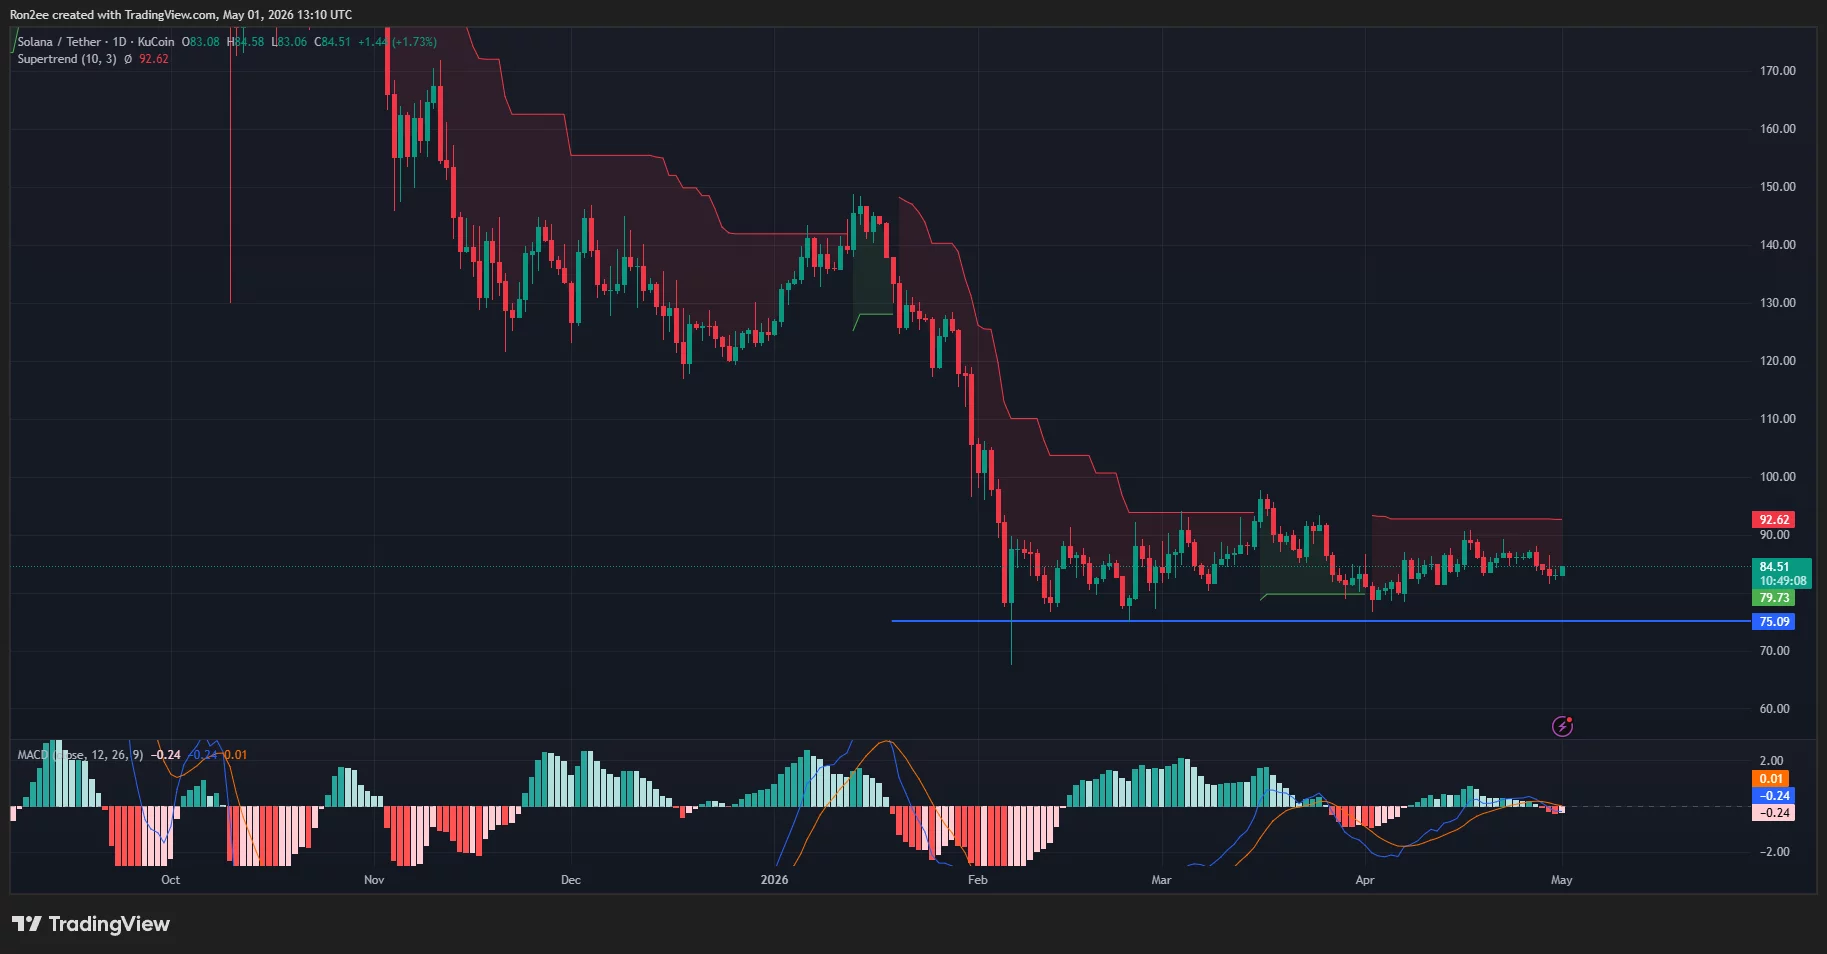
Solana price has repeatedly tested this region over the past several weeks, forming a base. However, rebounds have remained shallow, with resistance capping upside near $86, a level that coincides with the 20-day exponential moving average.
Momentum indicators are now turning negative. The MACD has formed a bearish crossover on the daily timeframe, with the histogram slipping back into negative territory. This suggests that short-term upward momentum is fading.
In addition, price remains below key trend indicators, with the Supertrend line positioned above current levels near $92, reinforcing the broader bearish bias.
A breakdown below the $78 support zone could trigger a sharper move lower, with $75 emerging as the next key downside level.
On the other hand, a sustained move above $86 would be needed to ease immediate pressure and shift momentum, though current indicators suggest that sellers still have the upper hand in the short term.
Disclosure: This article does not represent investment advice. The content and materials featured on this page are for educational purposes only.


Potrebbe anche piacerti
Twilio (TWLO) Stock Jumps 18% as Q1 Growth Hits a Three-Year High

CoreWeave (CRWV) Stock Surges 12% on $8.5B GPU-Backed Financing Deal — Here’s the Full Picture