

Bitcoin Price Stabilizes Above $76K, Traders Await Next Major Move
Bitcoin price started a fresh decline below the $76,800 zone. BTC is consolidating and might struggle to stay above the $76,000 support.
- Bitcoin failed to stay above $77,000 and extended losses.
- The price is trading below $77,200 and the 100 hourly simple moving average.
- There is a bearish trend line forming with resistance at $77,200 on the hourly chart of the BTC/USD pair (data feed from Kraken).
- The pair might extend losses if it stays below the $77,200 and $77,500 levels.
Bitcoin Price Consolidates Losses
Bitcoin price failed to stay above the $77,200 support zone. BTC remained in a bearish zone and extended losses below the $76,800 level. There was a move below the $76,500 level.
The price even dipped below $76,200. A low was formed at $76,020 and the price is now consolidating losses. It is still struggling below the 23.6% Fib retracement level of the downward move from the $82,018 swing high to the $76,020 low.
Bitcoin is now trading below $76,800 and the 100 hourly simple moving average. If the price remains stable above $76,000, it could attempt a fresh increase. Immediate resistance is near the $77,200 level. There is also a bearish trend line forming with resistance at $77,200 on the hourly chart of the BTC/USD pair.
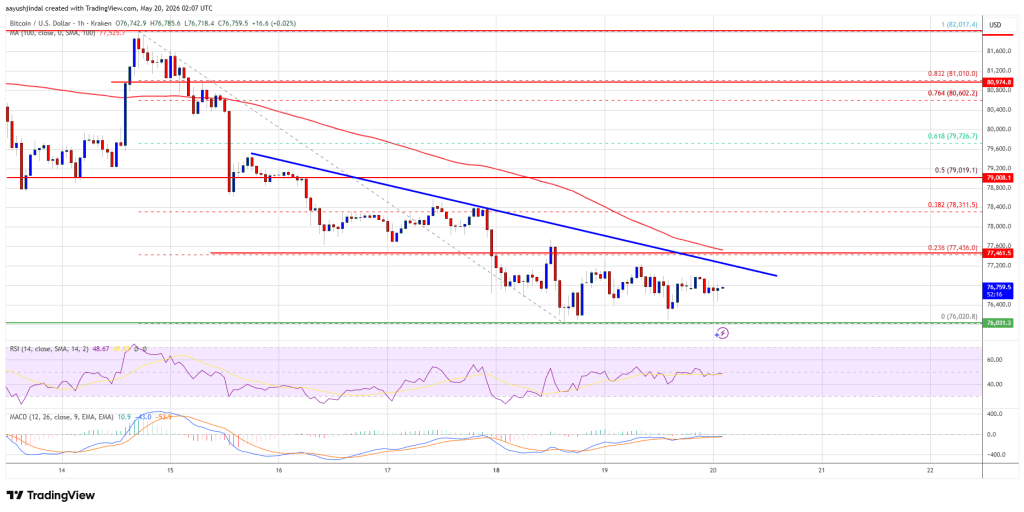
The first key resistance is near the $77,450 level. A close above the $77,450 resistance might send the price further higher. In the stated case, the price could rise and test the $79,000 resistance or the 50% Fib retracement level of the downward move from the $82,018 swing high to the $76,020 low. Any more gains might send the price toward the $80,000 level. The next barrier for the bulls could be $82,000.
Another Decline In BTC?
If Bitcoin fails to rise above the $77,450 resistance zone, it could start another decline. Immediate support is near the $76,400 level.
The first major support is near the $76,000 level. The next support is now near the $75,000 zone. Any more losses might send the price toward the $74,200 support in the near term. The main support now sits at $74,000, below which BTC might struggle to recover in the near term.
Technical indicators:
Hourly MACD – The MACD is now losing pace in the bearish zone.
Hourly RSI (Relative Strength Index) – The RSI for BTC/USD is now below the 50 level.
Major Support Levels – $76,000, followed by $75,000.
Major Resistance Levels – $77,200 and $77,450.


Potrebbe anche piacerti

Australian Dollar Dips Below 0.7100 as Middle East Tensions Weigh on Risk Sentiment

Fed Governor Calls For Strong Stablecoin Oversight As CLARITY Act’s Final Text Gets Delayed


