

Advanced Micro Devices Stock nears $514 as bulls face a hard ceiling

Advanced Micro Devices Stock is pressing higher, closing at 503.89 after testing 506.96. Bulls control the tape, but the 513–514 zone is a hot ceiling. The bias stays bullish; the next leg likely needs brief consolidation or a clean break through resistance.
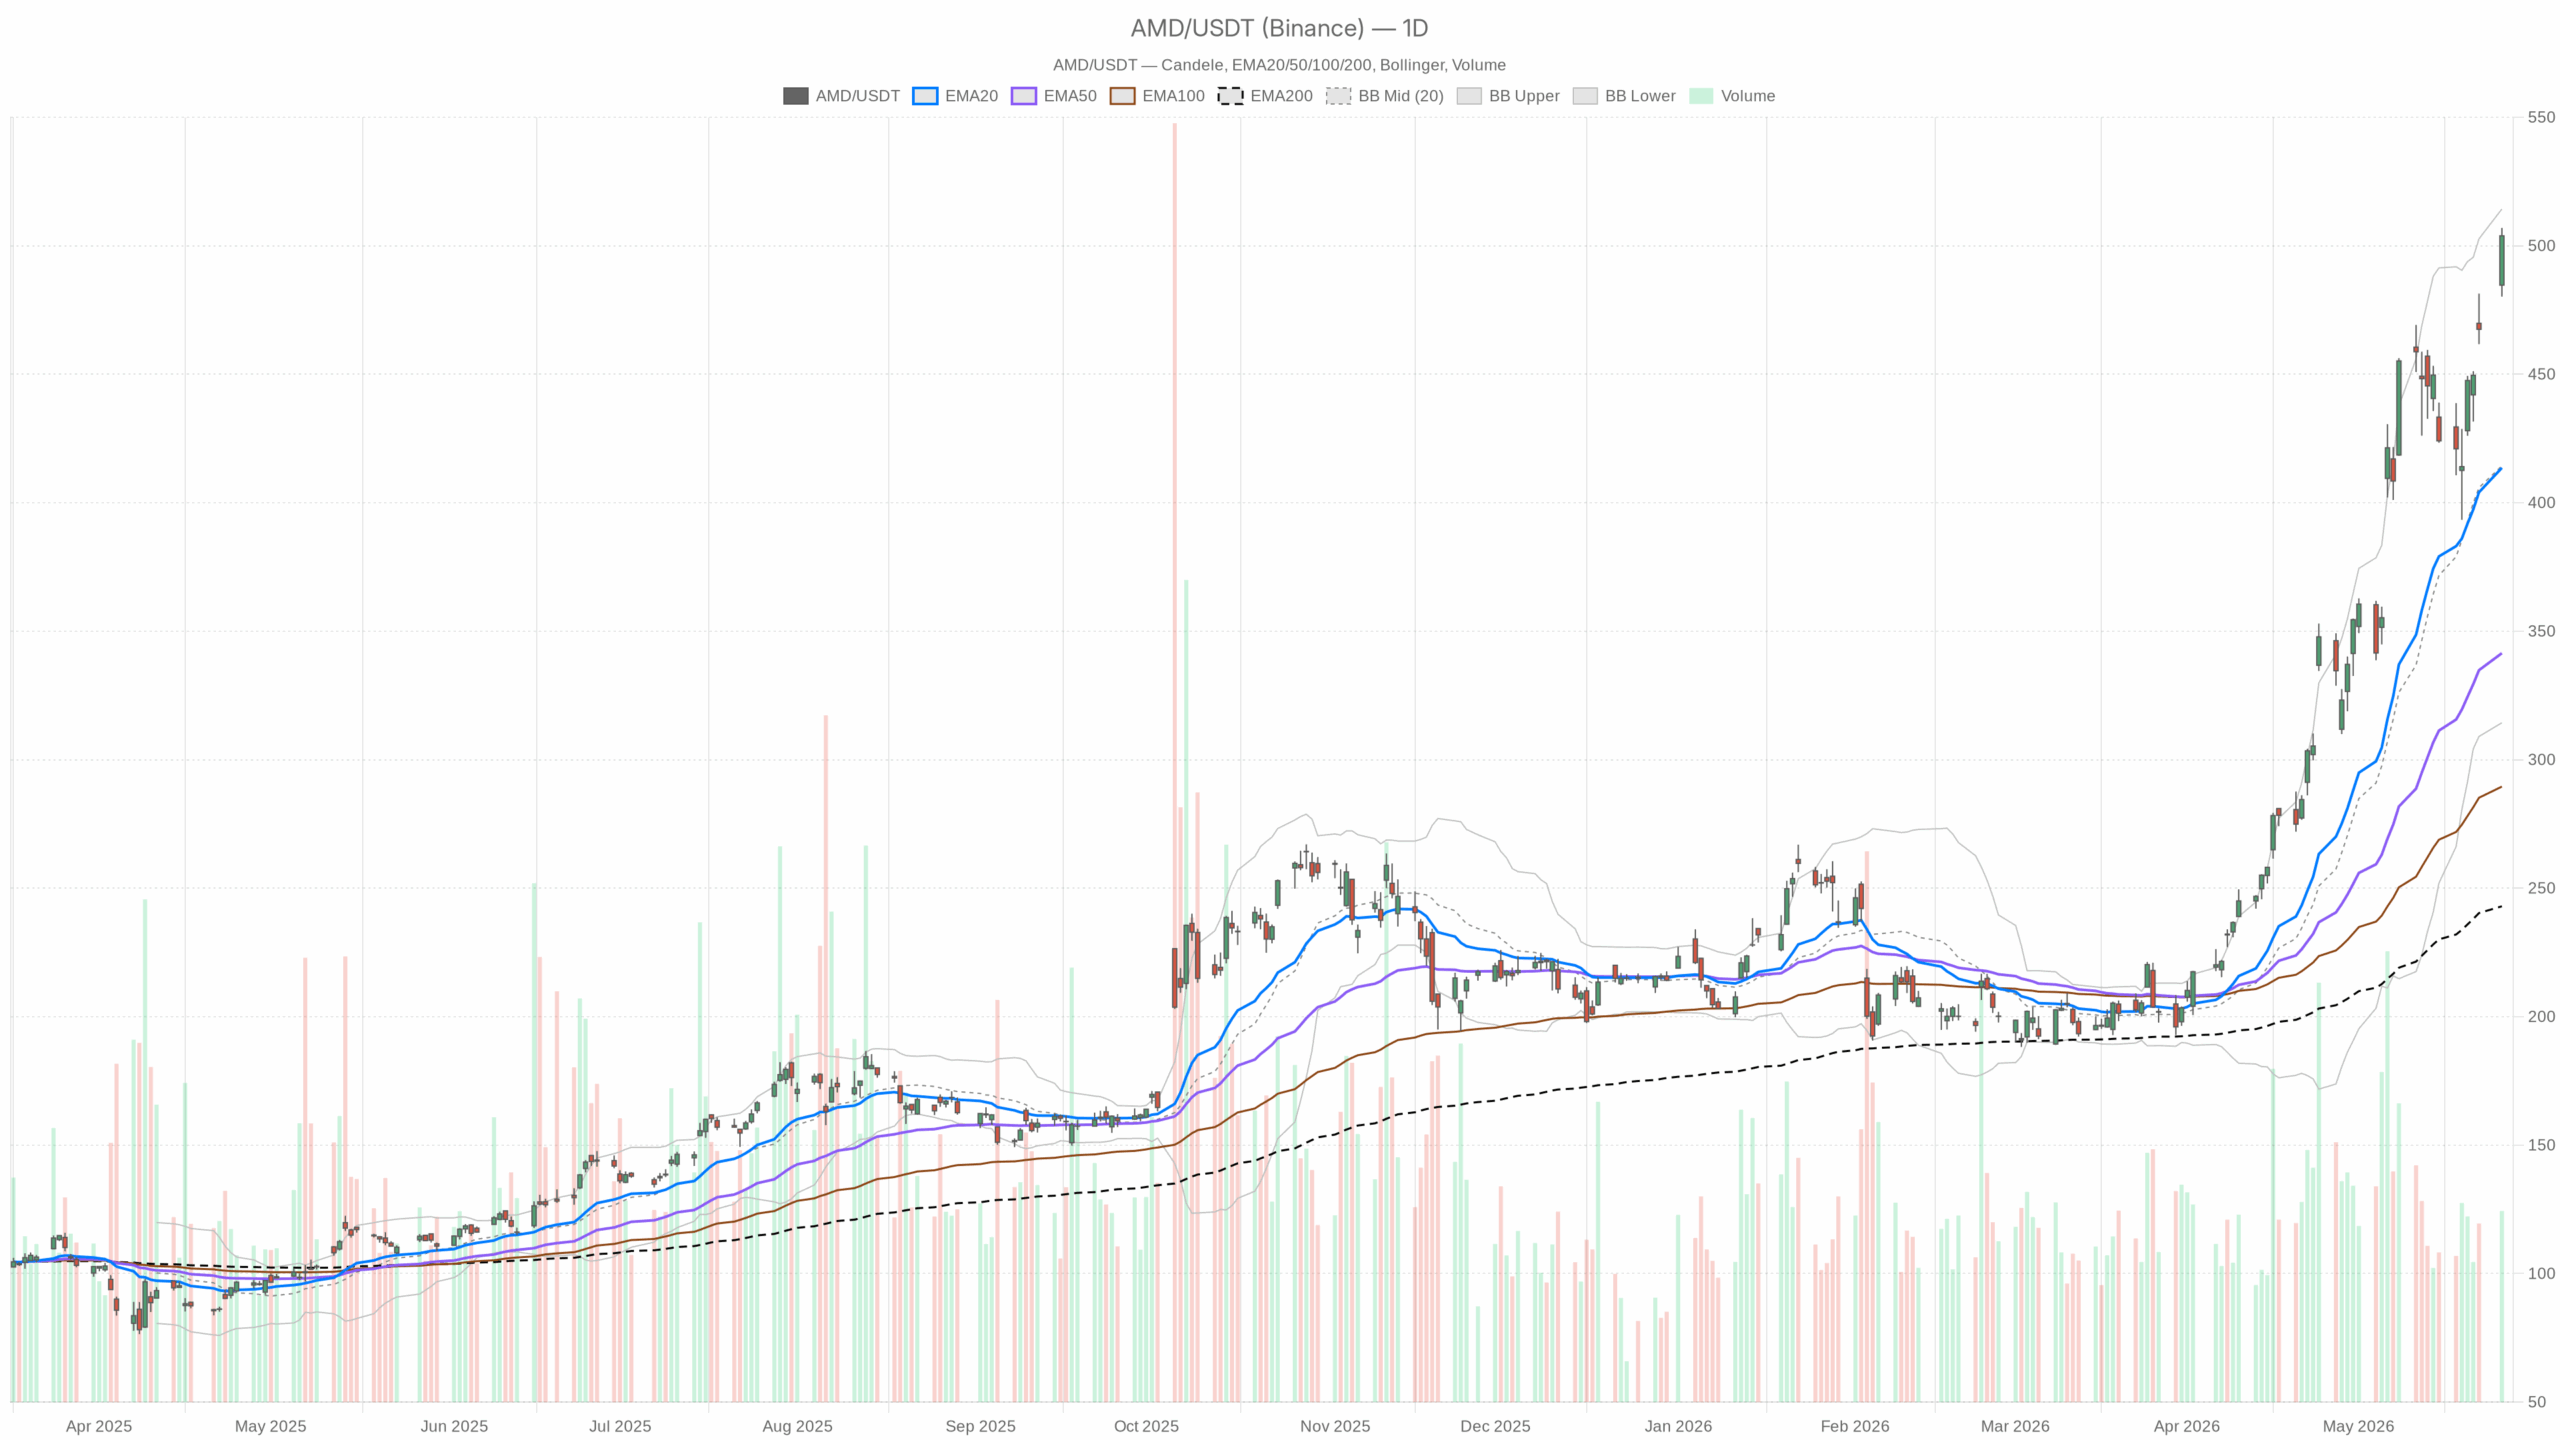 AMD — daily chart with candlesticks, EMA20/EMA50 and volume.
Advanced Micro Devices Stock: Daily Trend and Structure
On the daily chart, price sits far above the 20/50/200-day EMAs at 413.6/341.48/242.96. The uptrend is robust, and trend followers remain in control.
Daily momentum runs hot. RSI14 = 77.07. MACD is above signal with a modest histogram near 0.98. Bollinger center is 414.36, and the upper band sits near 514.33. Price is riding that upper band into the 513–514 ceiling.
Volatility is elevated. ATR14 = 32.52. The daily pivot is 497.03, with R1 = 513.82 and S1 = 487.09. Therefore, the 497.03–513.82 band frames the immediate battleground, while 487.09 marks the first deeper pullback area.
Intraday Technicals: 1H Strength, 15-Minute Digestion
Meanwhile, intraday structure backs the daily bias. On the 1H chart, EMAs at 476.2/454.9/386.24 are stacked higher. RSI14 = 76.33. The MACD histogram is +2.78. The Bollinger upper band sits near 515.26. ATR14 = 9.39. The hourly pivot is 504.09, with R1 = 505.48 and S1 = 502.24. Price is stalling just under a tight 504–506 cap, leaving room for swift two-way swings.
However, the 15-minute tape shows digestion. EMAs at 496.62/483.76/455.99 remain supportive, but RSI14 ≈ 71.47 is cooling. The MACD histogram has ticked negative at -0.20. The upper band is 506.46 and ATR14 = 3. With the pivot at 504.09, R1 = 505.48, and S1 = 502.24, brief dips toward 502–503 are favored before fresh attempts higher.
News and Sentiment Context for Advanced Micro Devices Stock
Notably, news flow skews toward AI-driven demand and product catalysts, with multiple outlets highlighting upside. Separate coverage flagged selling by a high-profile fund manager in AMD and TSMC. Therefore, sentiment leans bullish, but headline-driven supply can cap initial breakouts near resistance.
Trading Scenarios and Key Levels for AMD
Therefore, the base case remains bullish. A steady hold above the daily pivot at 497.03 keeps buyers in control. Intraday, reclaiming and sustaining trade above 505.48 would set up another run at the 513.82–514.33 confluence of R1 and the daily upper band. Clearing 514 on a sustained basis would confirm momentum extension and continuation within Advanced Micro Devices Stock’s prevailing trend.
On the other hand, the bullish case weakens if AMD repeatedly fails at 513–514 and slips back through 497.03. A daily close below 487.09 would mark a more meaningful loss of near-term structure. That sequence would shift the stance toward neutral to cautious and put the burden back on buyers to rebuild momentum.
Execution and Volatility Considerations
In contrast, the short-term setup is mixed: the daily and hourly trends are strong, while the 15-minute shows pause. Execution should respect the 504–506 band for confirmation and the 502–503 area for dips. Still, momentum favors upside, and timing trades around intraday pivots can reduce slippage in a fast tape.
Overall, AMD’s uptrend is intact with volatility elevated. ATRs across timeframes argue for wider ranges and quick reversals. Until 497 breaks on a closing basis, pullbacks look like digestion within a bullish regime. Above 514, upside can resume with pace for Advanced Micro Devices Stock.


Potrebbe anche piacerti

5 Features Every AI Trading Agent Will Expect From DeFi

Iran threatens retaliation as Trump vows to “hit hard,” crypto market under stress
Terra Luna Classic Bulls Refuse to Give Up: Another LUNC Rally Seems Close


Notizie di tendenza
Altro
